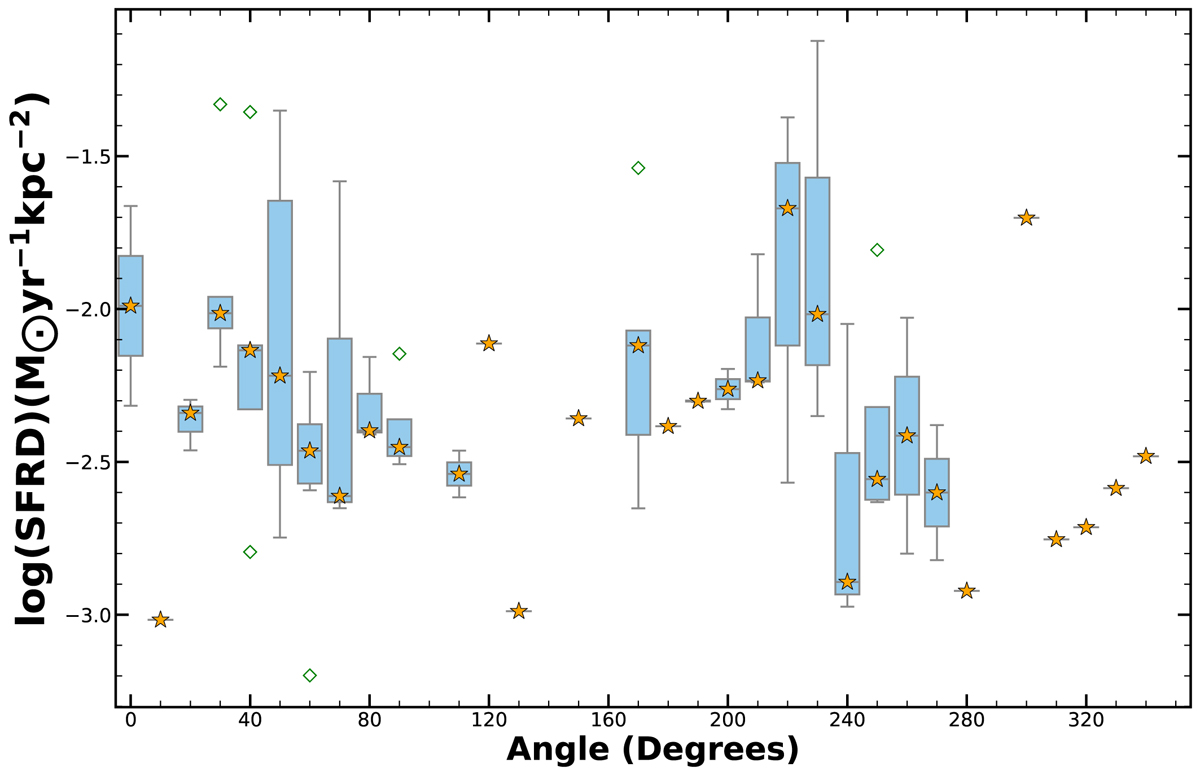
Fig. 4.
Download original image
Distribution of SFRD in the identified regions of the inner ring of the galaxy (region shown in the inset of Fig. 1) based on their angles relative to north in a boxplot. The box represents the interquartile range of the observed SFRD, the orange stars indicate the median of the SFRD, and the whiskers depict data points within the range of 1.5 times the interquartile range. Outliers, depicted as green diamonds beyond the whisker limits, are values that fall outside this range. Individual hyphen markers in some places indicate that only a single star-forming region subtends the corresponding angle. We observe a peak in the SFRD at the area of the inner ring in conjunction with the ends of the bar.
Current usage metrics show cumulative count of Article Views (full-text article views including HTML views, PDF and ePub downloads, according to the available data) and Abstracts Views on Vision4Press platform.
Data correspond to usage on the plateform after 2015. The current usage metrics is available 48-96 hours after online publication and is updated daily on week days.
Initial download of the metrics may take a while.