Fig. 3.
Download original image
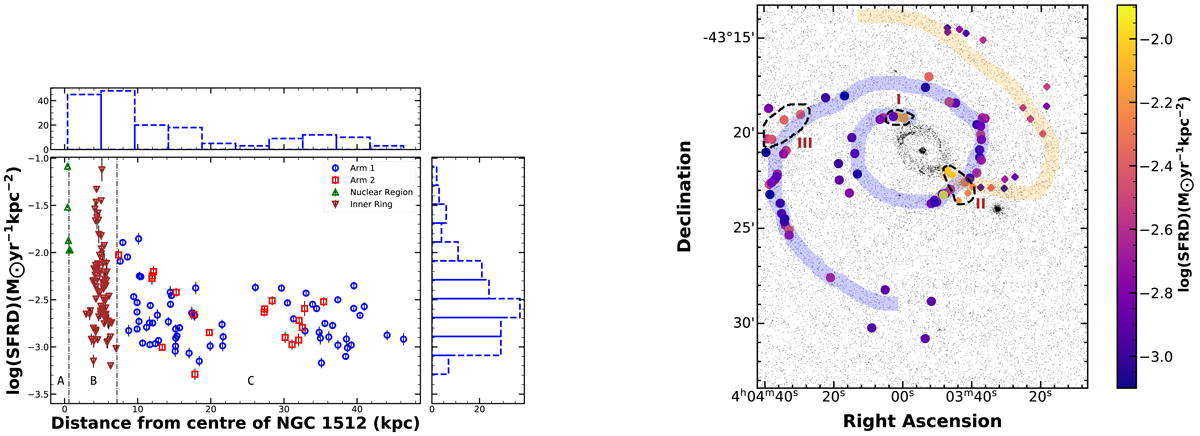
Distribution of SFRD in NGC 1512. Left: distribution of SFRD of the regions with respect to the deprojected radial distance from the centre of the galaxy. The SFRD of a region is calculated by dividing its estimated SFR by the area of the region in kpc2. It can be observed that the nuclear and inner ring regions of the galaxy (Areas A and B) exhibit higher orders of SFRD (log(SFRD[M⊙ yr−1 kpc−2]) > −1.5). On the other hand, the regions of the spiral exhibit lower SFRD (Area C). The histograms parallel to the axes show the distribution of the SFRD and the distance from the centre of NGC 1512 for the corresponding regions. Right: the regions identified as part of Arms 1 and 2. The circular symbols represent Arm 1, while the diamond symbols represent Arm 2. The trajectories of the spiral arms, as identified in Fig. 2 (right panel), are plotted to indicate their positions. We see an asymmetric distribution of SFRDs. Region I coincides with the origin of Arm 1 and exhibits enhanced star formation (log(SFRDmean[M⊙ yr−1 kpc−2]) ∼ −2.01). Region II shows local enhancements of star formation, with (log(SFRDmean[M⊙ yr−1 kpc−2]) ∼ −2.28). Regions in the outer part of Arm 1, denoted by Region III, also show heightened values when compared to other regions of Arm 1, with log(SFRDmean[M⊙ yr−1 kpc−2]) ∼ −2.36.
Current usage metrics show cumulative count of Article Views (full-text article views including HTML views, PDF and ePub downloads, according to the available data) and Abstracts Views on Vision4Press platform.
Data correspond to usage on the plateform after 2015. The current usage metrics is available 48-96 hours after online publication and is updated daily on week days.
Initial download of the metrics may take a while.