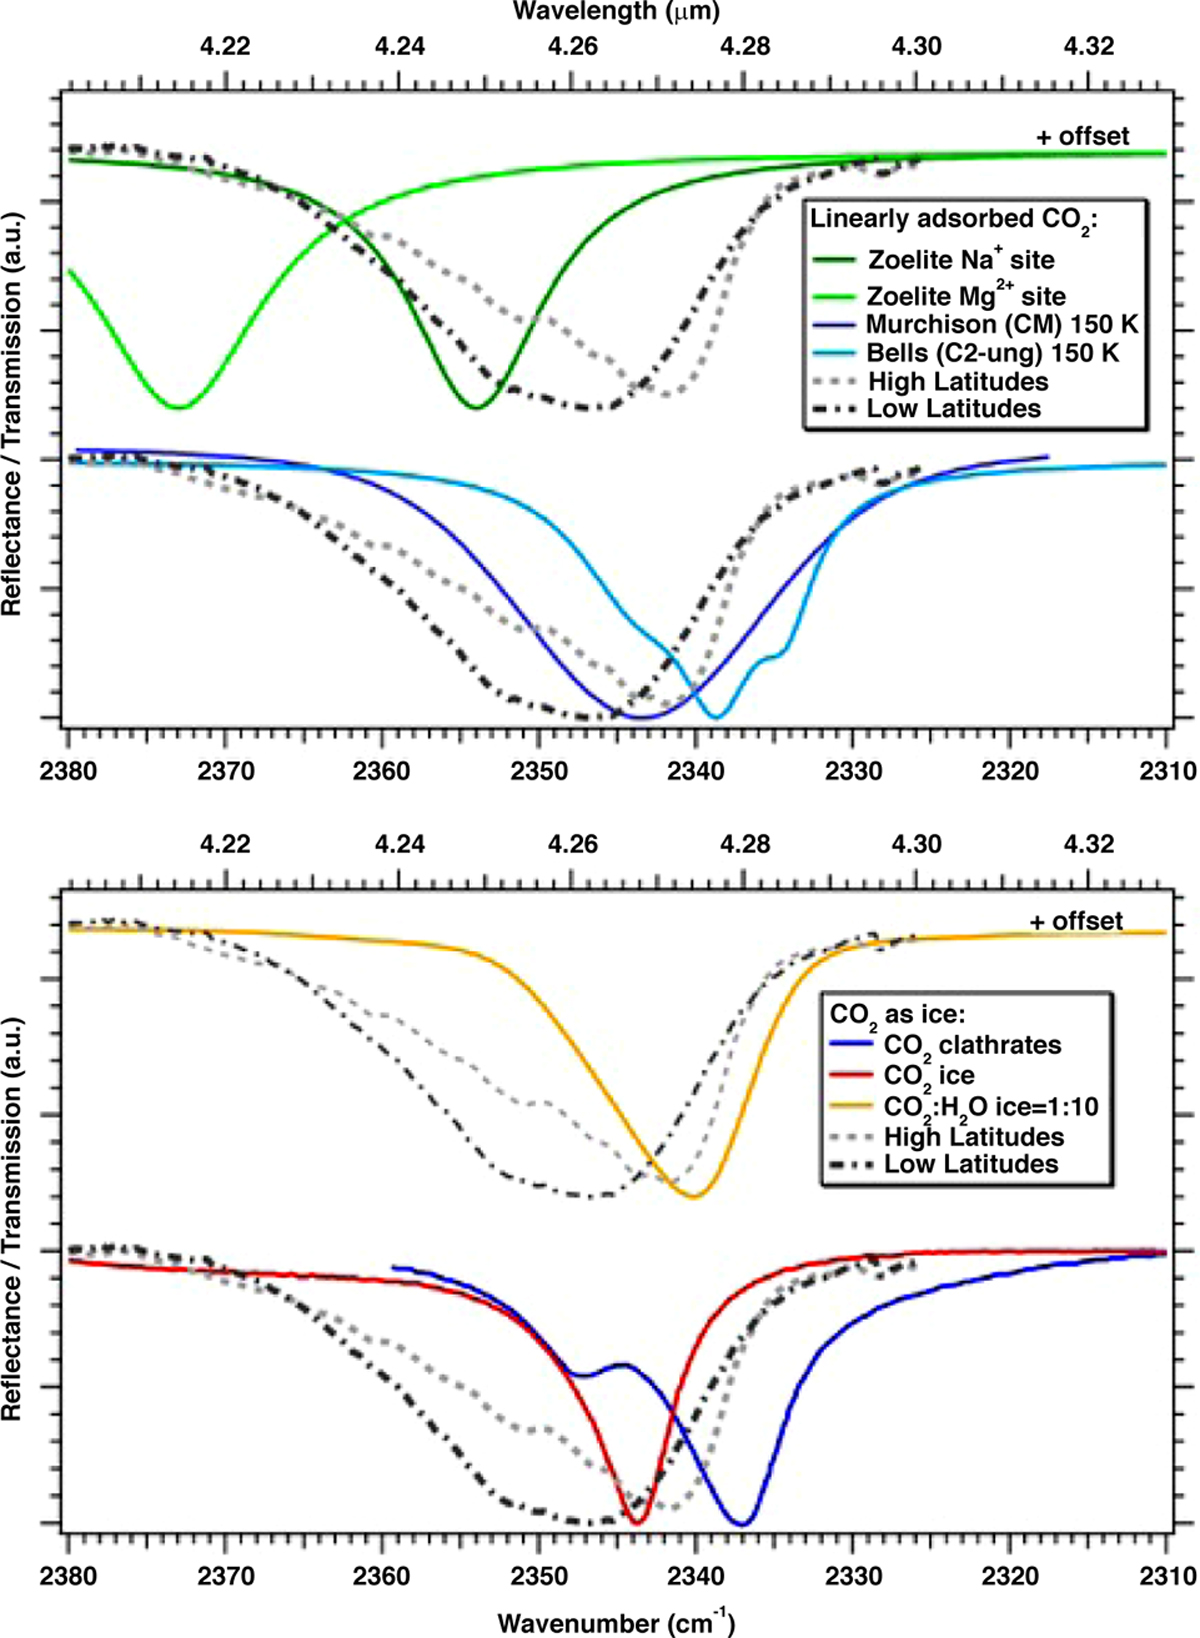
Fig. 27
Download original image
Comparison with laboratory data. CO2 band in Ganymede spectra at the pole (60–75°N; dotted light gray lines) and the equator (0–15°N; dot-dashed gray lines) of the leading hemisphere compared with transmission spectra from Berlanga et al. (2016; carboneous chondrites), Bekhti et al. (2021; zeolites), Ehrenfreund et al. (1999; CO2 ice and CO2-H2O ice mixture) and Fleyfel & Devlin (1991; CO2 clathrates). Some spectra are vertically shifted for the sake of clarity.
Current usage metrics show cumulative count of Article Views (full-text article views including HTML views, PDF and ePub downloads, according to the available data) and Abstracts Views on Vision4Press platform.
Data correspond to usage on the plateform after 2015. The current usage metrics is available 48-96 hours after online publication and is updated daily on week days.
Initial download of the metrics may take a while.