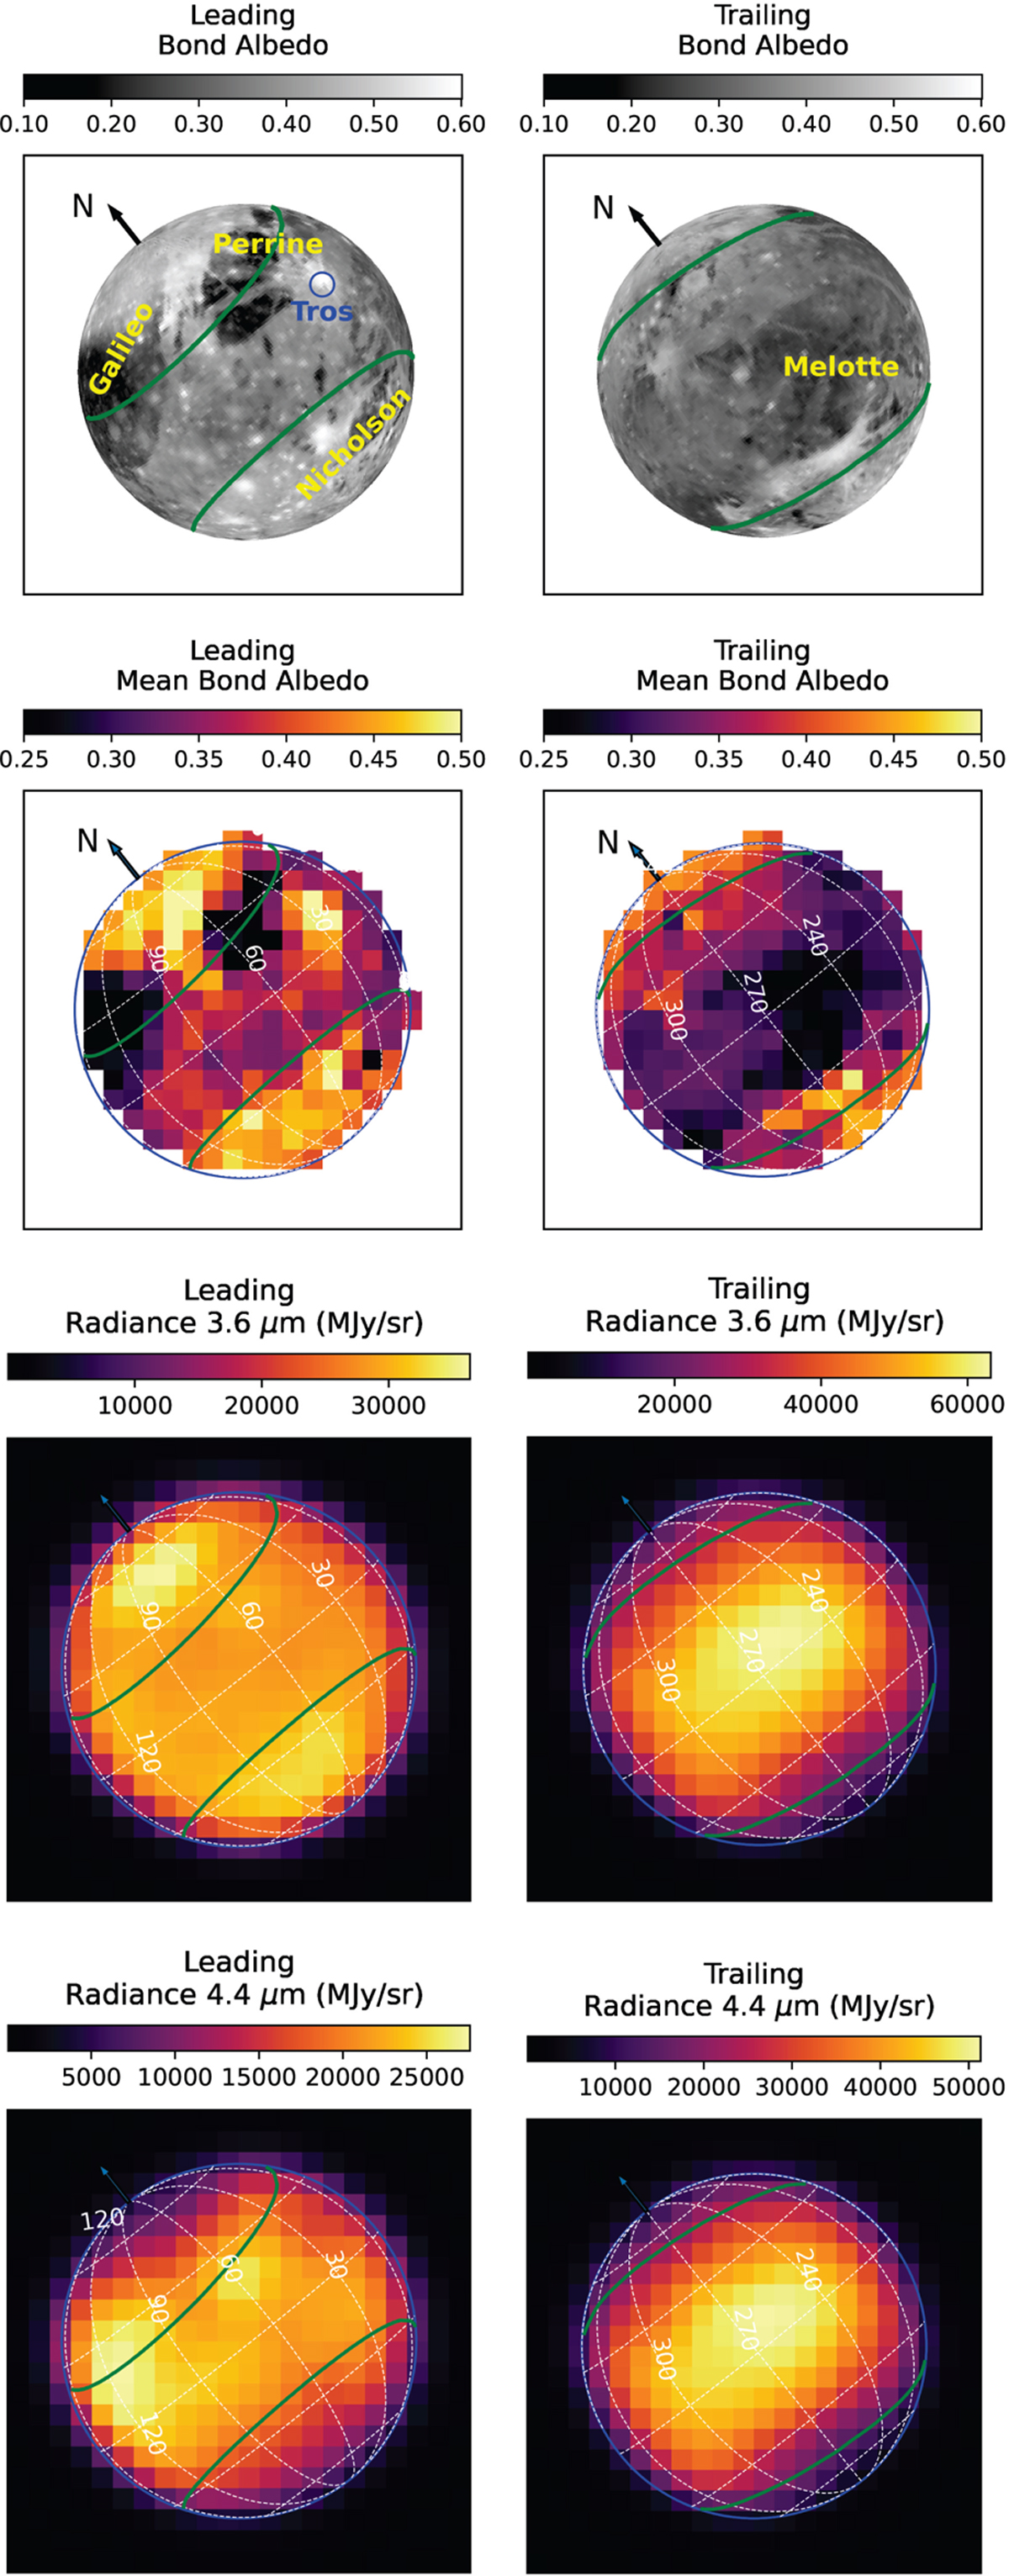
Fig. 2
Download original image
Ganymede Bond albedo and 3.6-µm, 4.4-µm radiance maps. From top to bottom: context Bond albedo maps derived by de Kleer et al. (2021) from Voyager-Galileo mosaic with the dashed green lines showing the open-closed-field line-boundary (Duling et al. 2022), resulting Bond albedo maps after projection in the NIRSpec IFU spaxels (see text), NIRSpec radiance images at 3.6 (NRS1) and 4.4 (NRS2) µm. In the context maps, dark Regiones are indicated by their names in yellow, and the blue circle shows the position of the Tros crater. Iso-latitude and longitude lines are drawn by increments of 30°. The color scale is different for each map, except for the Bond albedo maps. Left side: leading hemisphere. Right side: trailing hemisphere.
Current usage metrics show cumulative count of Article Views (full-text article views including HTML views, PDF and ePub downloads, according to the available data) and Abstracts Views on Vision4Press platform.
Data correspond to usage on the plateform after 2015. The current usage metrics is available 48-96 hours after online publication and is updated daily on week days.
Initial download of the metrics may take a while.