Fig. 19
Download original image
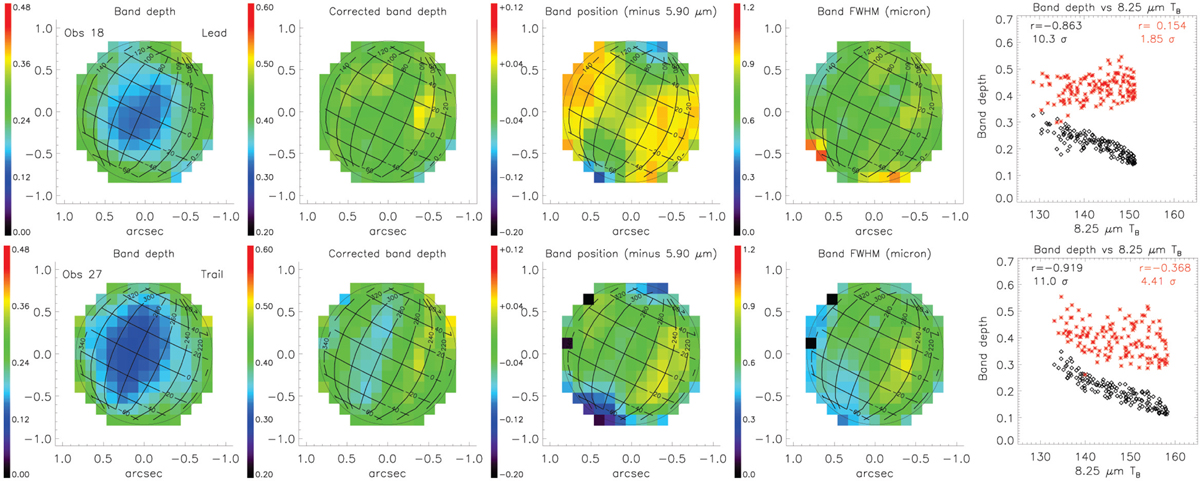
Fitted characteristics of the 5.9-µm band. Shown are results for Obs. 18 (leading side, first row) and Obs. 27 (trailing side, second row), using model 2 described in the text: observed band depth relative to total continuum, band depth corrected for thermal contribution (i.e., relative to model solar reflected component), band position (offset from 5.90 µm), and band FWHM width. The last column shows the correlation between the observed (black) and corrected (red) band depths with the observed 8.25 µm TB. Spearman correlation coefficients and number of standard deviations significance are indicated as insets. Similar figures for models 1 and 3 can be found in Fig. F.3.
Current usage metrics show cumulative count of Article Views (full-text article views including HTML views, PDF and ePub downloads, according to the available data) and Abstracts Views on Vision4Press platform.
Data correspond to usage on the plateform after 2015. The current usage metrics is available 48-96 hours after online publication and is updated daily on week days.
Initial download of the metrics may take a while.