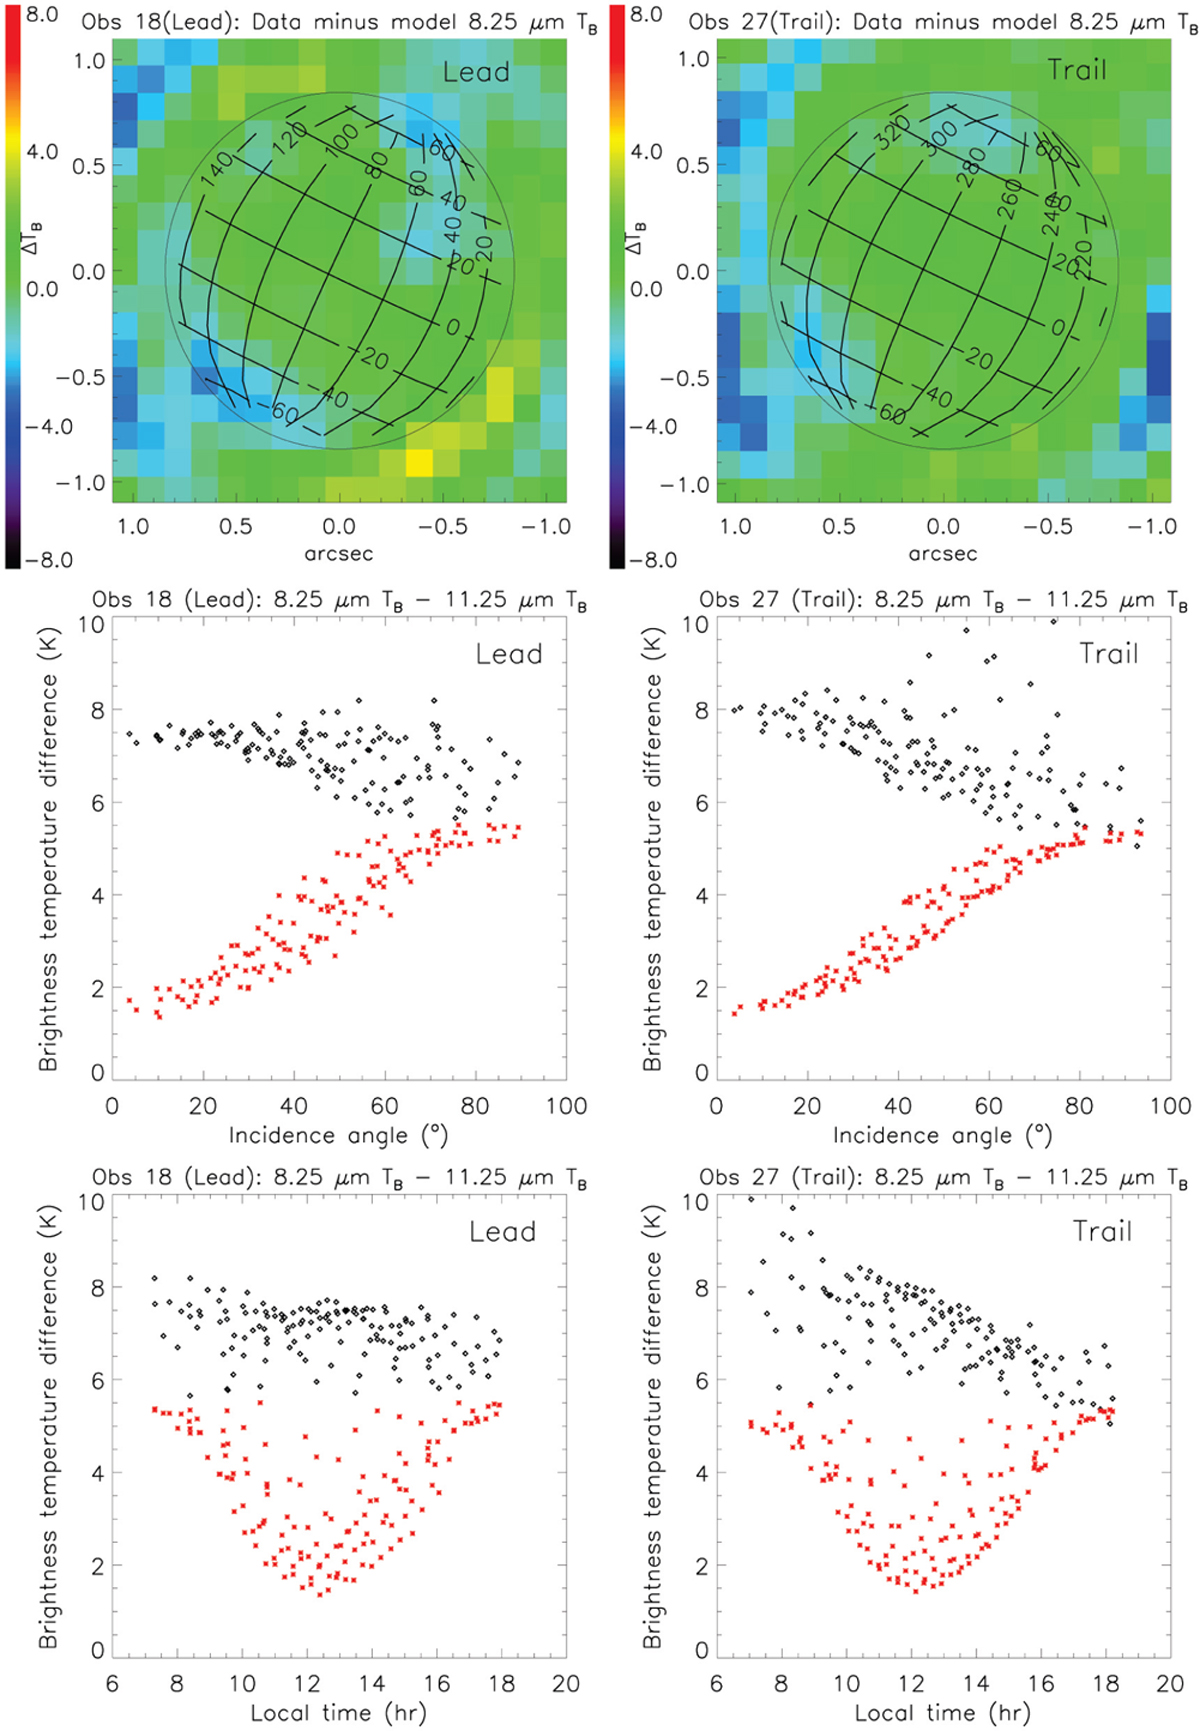
Fig. 18
Download original image
Difference plots. Top: difference between observed and modeled TB,8.25, for the rough, Bond albedo-rescaled, model (last column of Fig. F.1). Middle: TB,8.25 – TB,11.25 brightness temperature difference as a function of incidence angle. Bottom: TB,8.25 – TB,11.25 brightness temperature difference as a function of local time. Black: data. Red: model. Left: leading side (Obs. 18). Right: trailing side (Obs. 27).
Current usage metrics show cumulative count of Article Views (full-text article views including HTML views, PDF and ePub downloads, according to the available data) and Abstracts Views on Vision4Press platform.
Data correspond to usage on the plateform after 2015. The current usage metrics is available 48-96 hours after online publication and is updated daily on week days.
Initial download of the metrics may take a while.