Fig. 15
Download original image
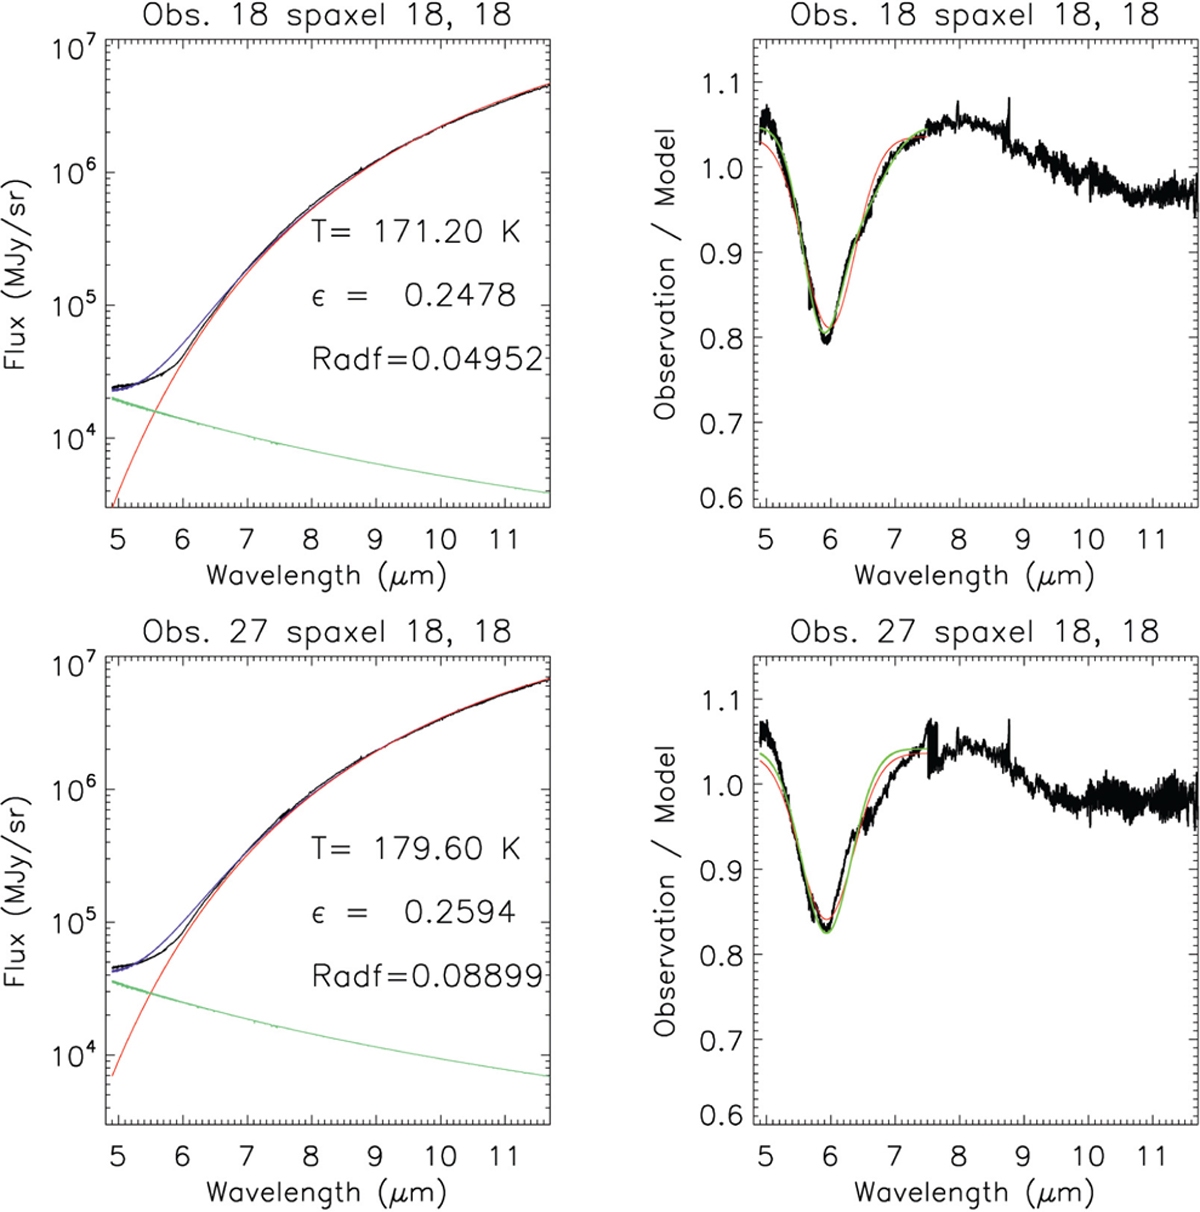
Example of spectral fits to MIRI data. Left panels: fit of disk-center spectra (spaxel 18, 18) in Obs. 18 (leading, top) and 27 (trailing, bottom) in radiance units with the sum of thermal and solar reflected components. Black: data. Red: thermal component. Green: solar reflected component. Blue: total model. Right panels: ratios between observations and models.
Current usage metrics show cumulative count of Article Views (full-text article views including HTML views, PDF and ePub downloads, according to the available data) and Abstracts Views on Vision4Press platform.
Data correspond to usage on the plateform after 2015. The current usage metrics is available 48-96 hours after online publication and is updated daily on week days.
Initial download of the metrics may take a while.