Fig. 14
Download original image
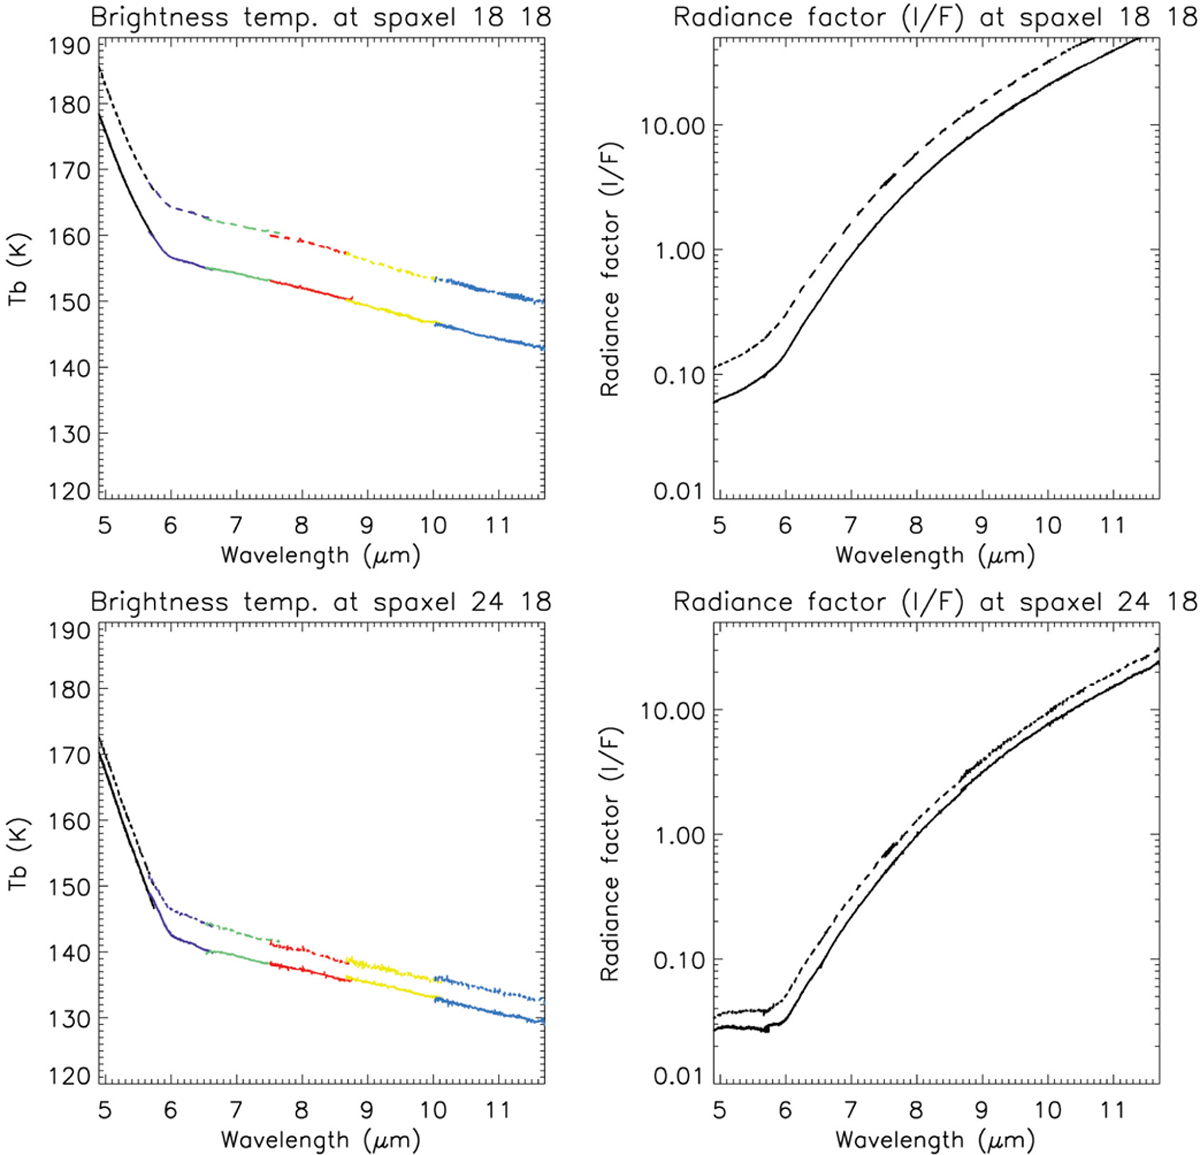
MIRI sample spectra at 4.9–11.7 µm. Shown are spectra from Obs. 18 (leading hemisphere, solid line) and 27 (trailing hemisphere, dashed line), at reconstructed disk center (spaxel 18, 18, top) and at off-sets RA = 0.65″, Dec = 0″ from this position (spaxel 24, 18, bottom). Spectra are calibrated either in brightness temperature (TB, left panels) with different colors illustrating different bands from 1A to 2C, or radiance factor (I/F, right panels). They are not corrected for any account of “filling factor” associated with the fact that for positions close to limb, the PSF partly samples empty space.
Current usage metrics show cumulative count of Article Views (full-text article views including HTML views, PDF and ePub downloads, according to the available data) and Abstracts Views on Vision4Press platform.
Data correspond to usage on the plateform after 2015. The current usage metrics is available 48-96 hours after online publication and is updated daily on week days.
Initial download of the metrics may take a while.