Fig. 13
Download original image
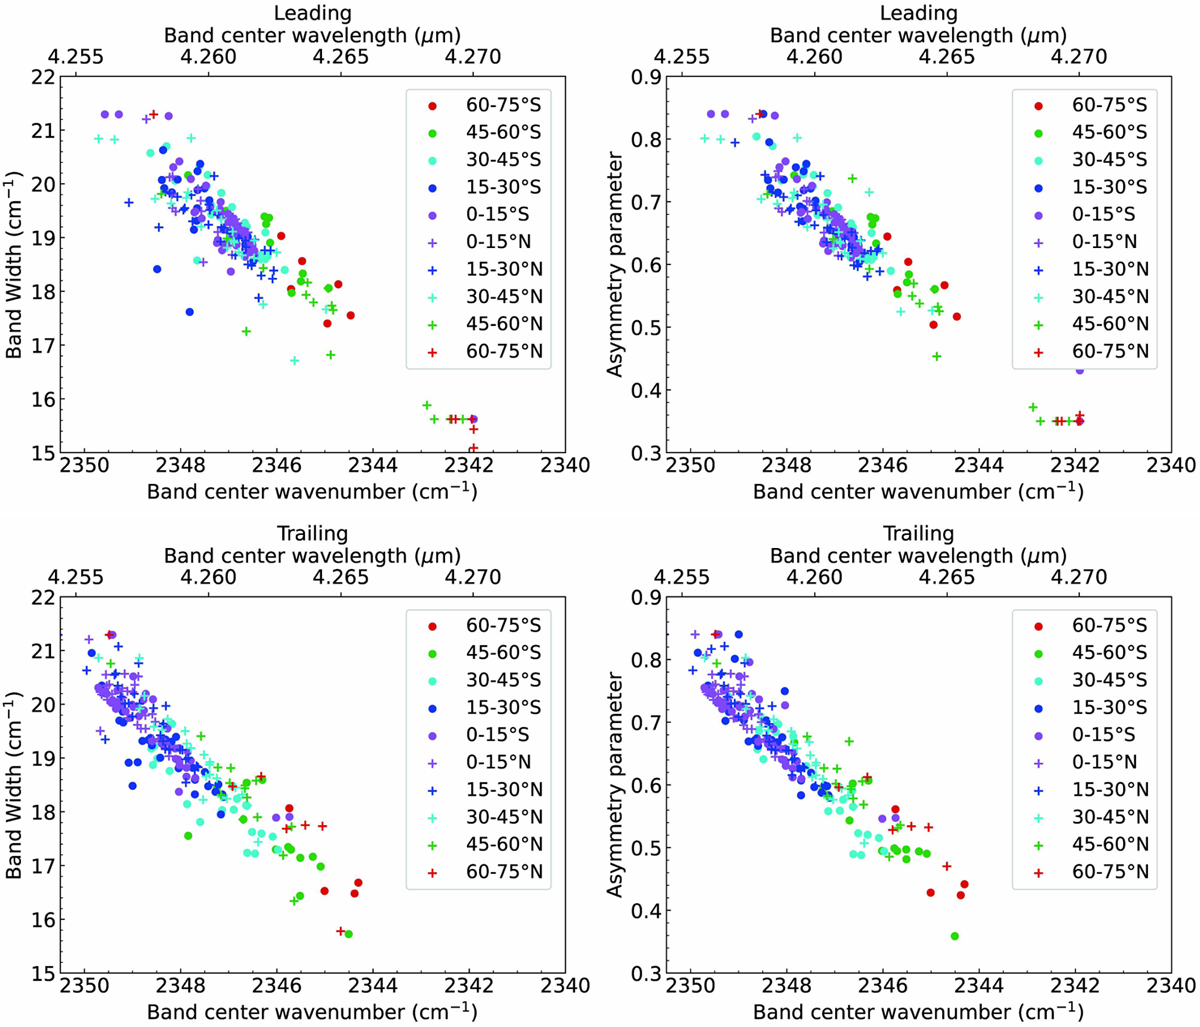
Correlations between CO2 band width and band center, and between asymmetry parameter asp and band center. Each data point corresponds to one NIRSpec spaxel on the Ganymede disk. The different symbols and colors indicate the latitude range as given in the inset. Upper plots: leading hemisphere; bottom plots: trailing hemisphere.
Current usage metrics show cumulative count of Article Views (full-text article views including HTML views, PDF and ePub downloads, according to the available data) and Abstracts Views on Vision4Press platform.
Data correspond to usage on the plateform after 2015. The current usage metrics is available 48-96 hours after online publication and is updated daily on week days.
Initial download of the metrics may take a while.