Fig. 10
Download original image
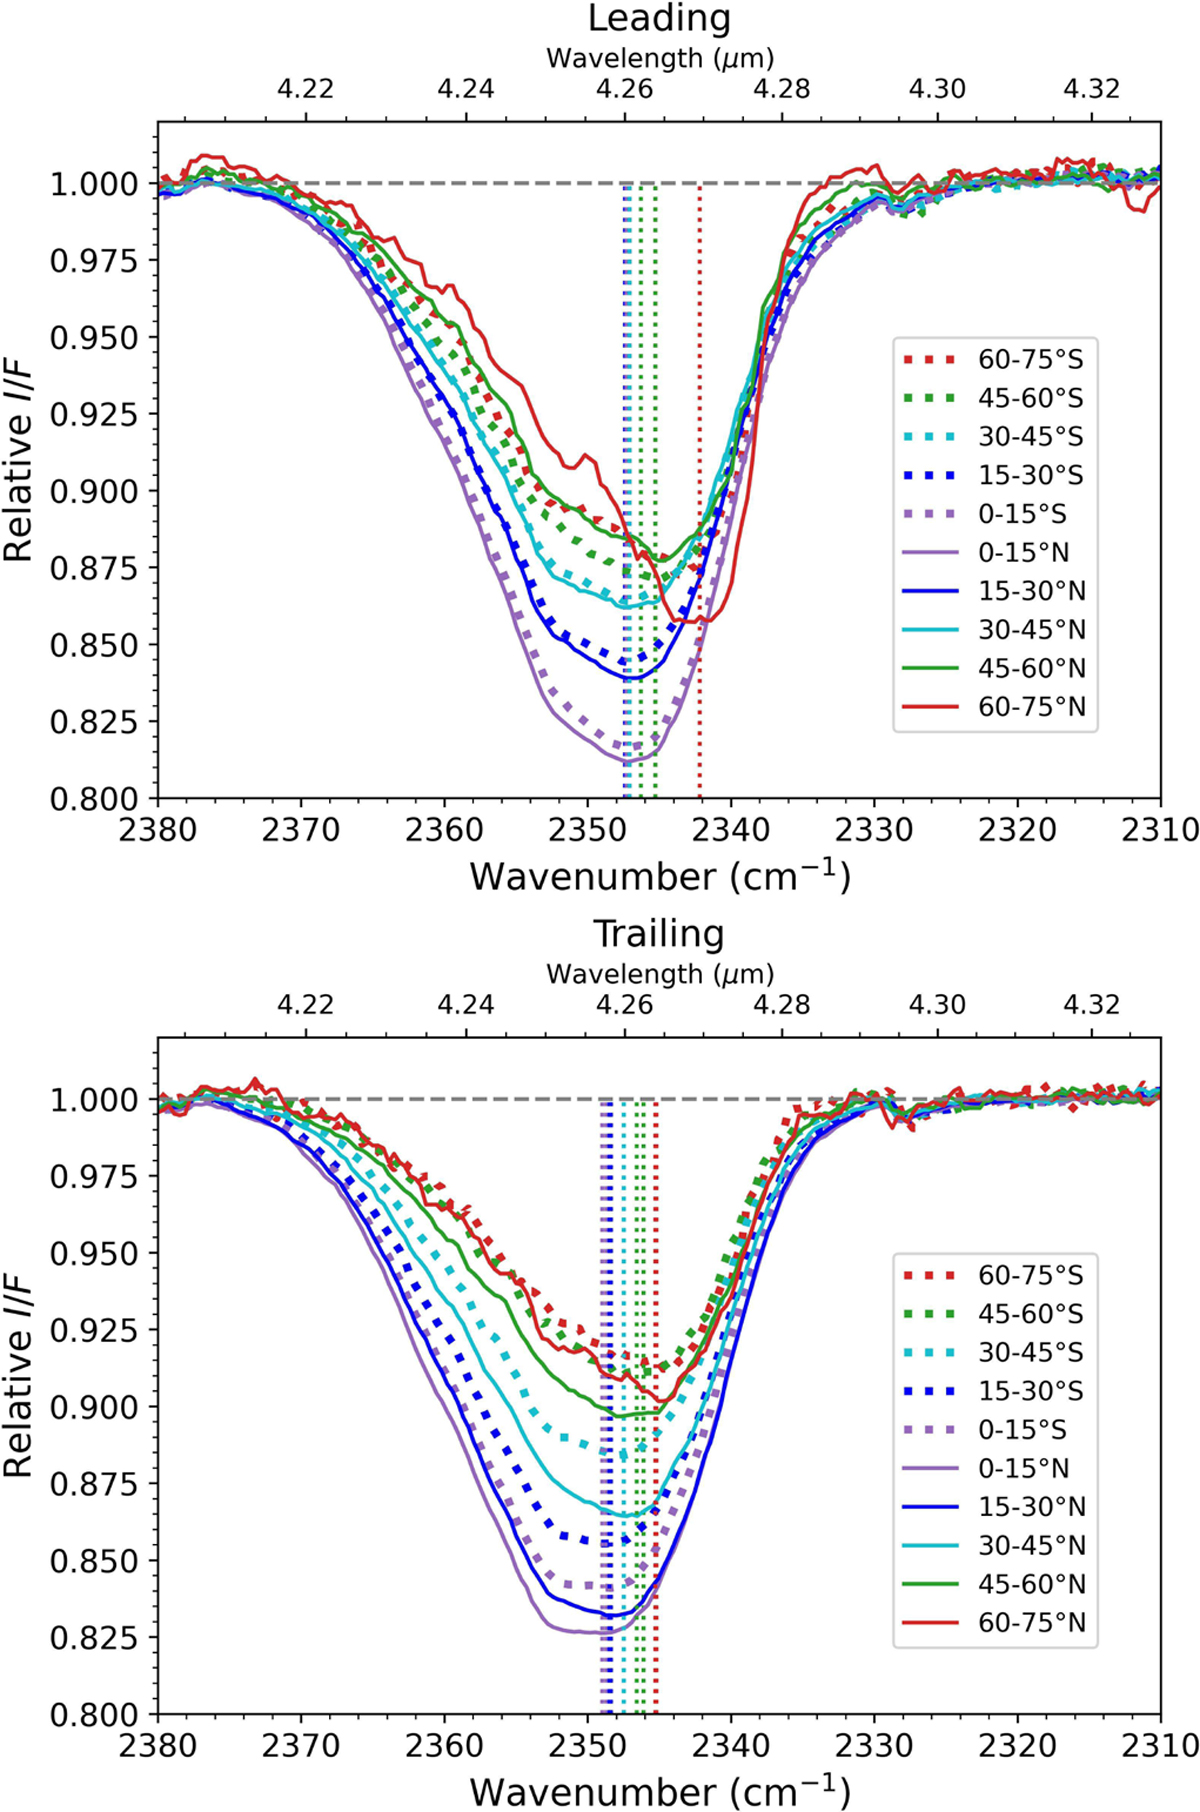
CO2 4.26-µm band spectra as a function of latitude. CO2 band normalized to the underlying continuum, from averages over latitude bins of I/F spectra. Latitude bins are given in the right panels, with spectra from southern latitudes drawn in dashed lines and northern latitudes in solid lines. The vertical lines show the central positions (given in Table 2) of the fitted asymmetric Gaussians with the same color code as for the spectra.
Current usage metrics show cumulative count of Article Views (full-text article views including HTML views, PDF and ePub downloads, according to the available data) and Abstracts Views on Vision4Press platform.
Data correspond to usage on the plateform after 2015. The current usage metrics is available 48-96 hours after online publication and is updated daily on week days.
Initial download of the metrics may take a while.