Fig. 8
Download original image
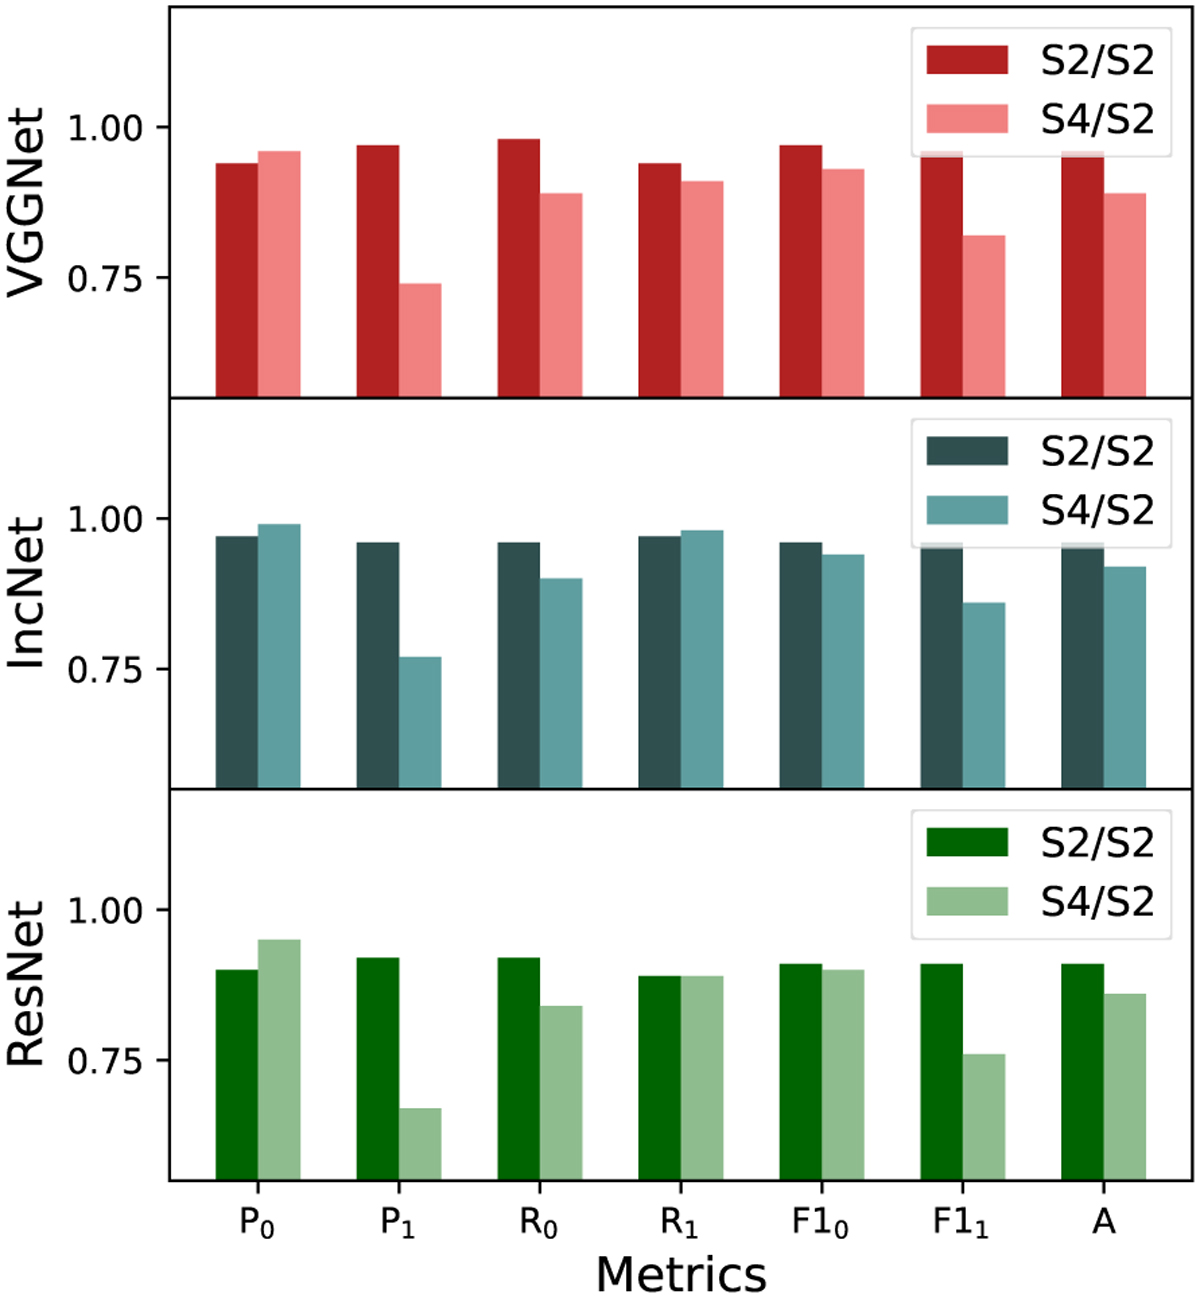
Comparison of the tests S2/S2 and S4/S2 (darker and lighter histograms) run with the VGG-like network (top), the IncNet (center), and the ResNet (bottom). In each panel, we show the results for the different metrics. From left to right, we show the precision on the class of the nonlenses (P0) and lenses (P1), the recall on the class of the nonlenses (R0) and lenses (R1), the F1-score on the class of the nonlenses (F10) and lenses (F11), and the overall accuracy (A).
Current usage metrics show cumulative count of Article Views (full-text article views including HTML views, PDF and ePub downloads, according to the available data) and Abstracts Views on Vision4Press platform.
Data correspond to usage on the plateform after 2015. The current usage metrics is available 48-96 hours after online publication and is updated daily on week days.
Initial download of the metrics may take a while.