Fig. 5
Download original image
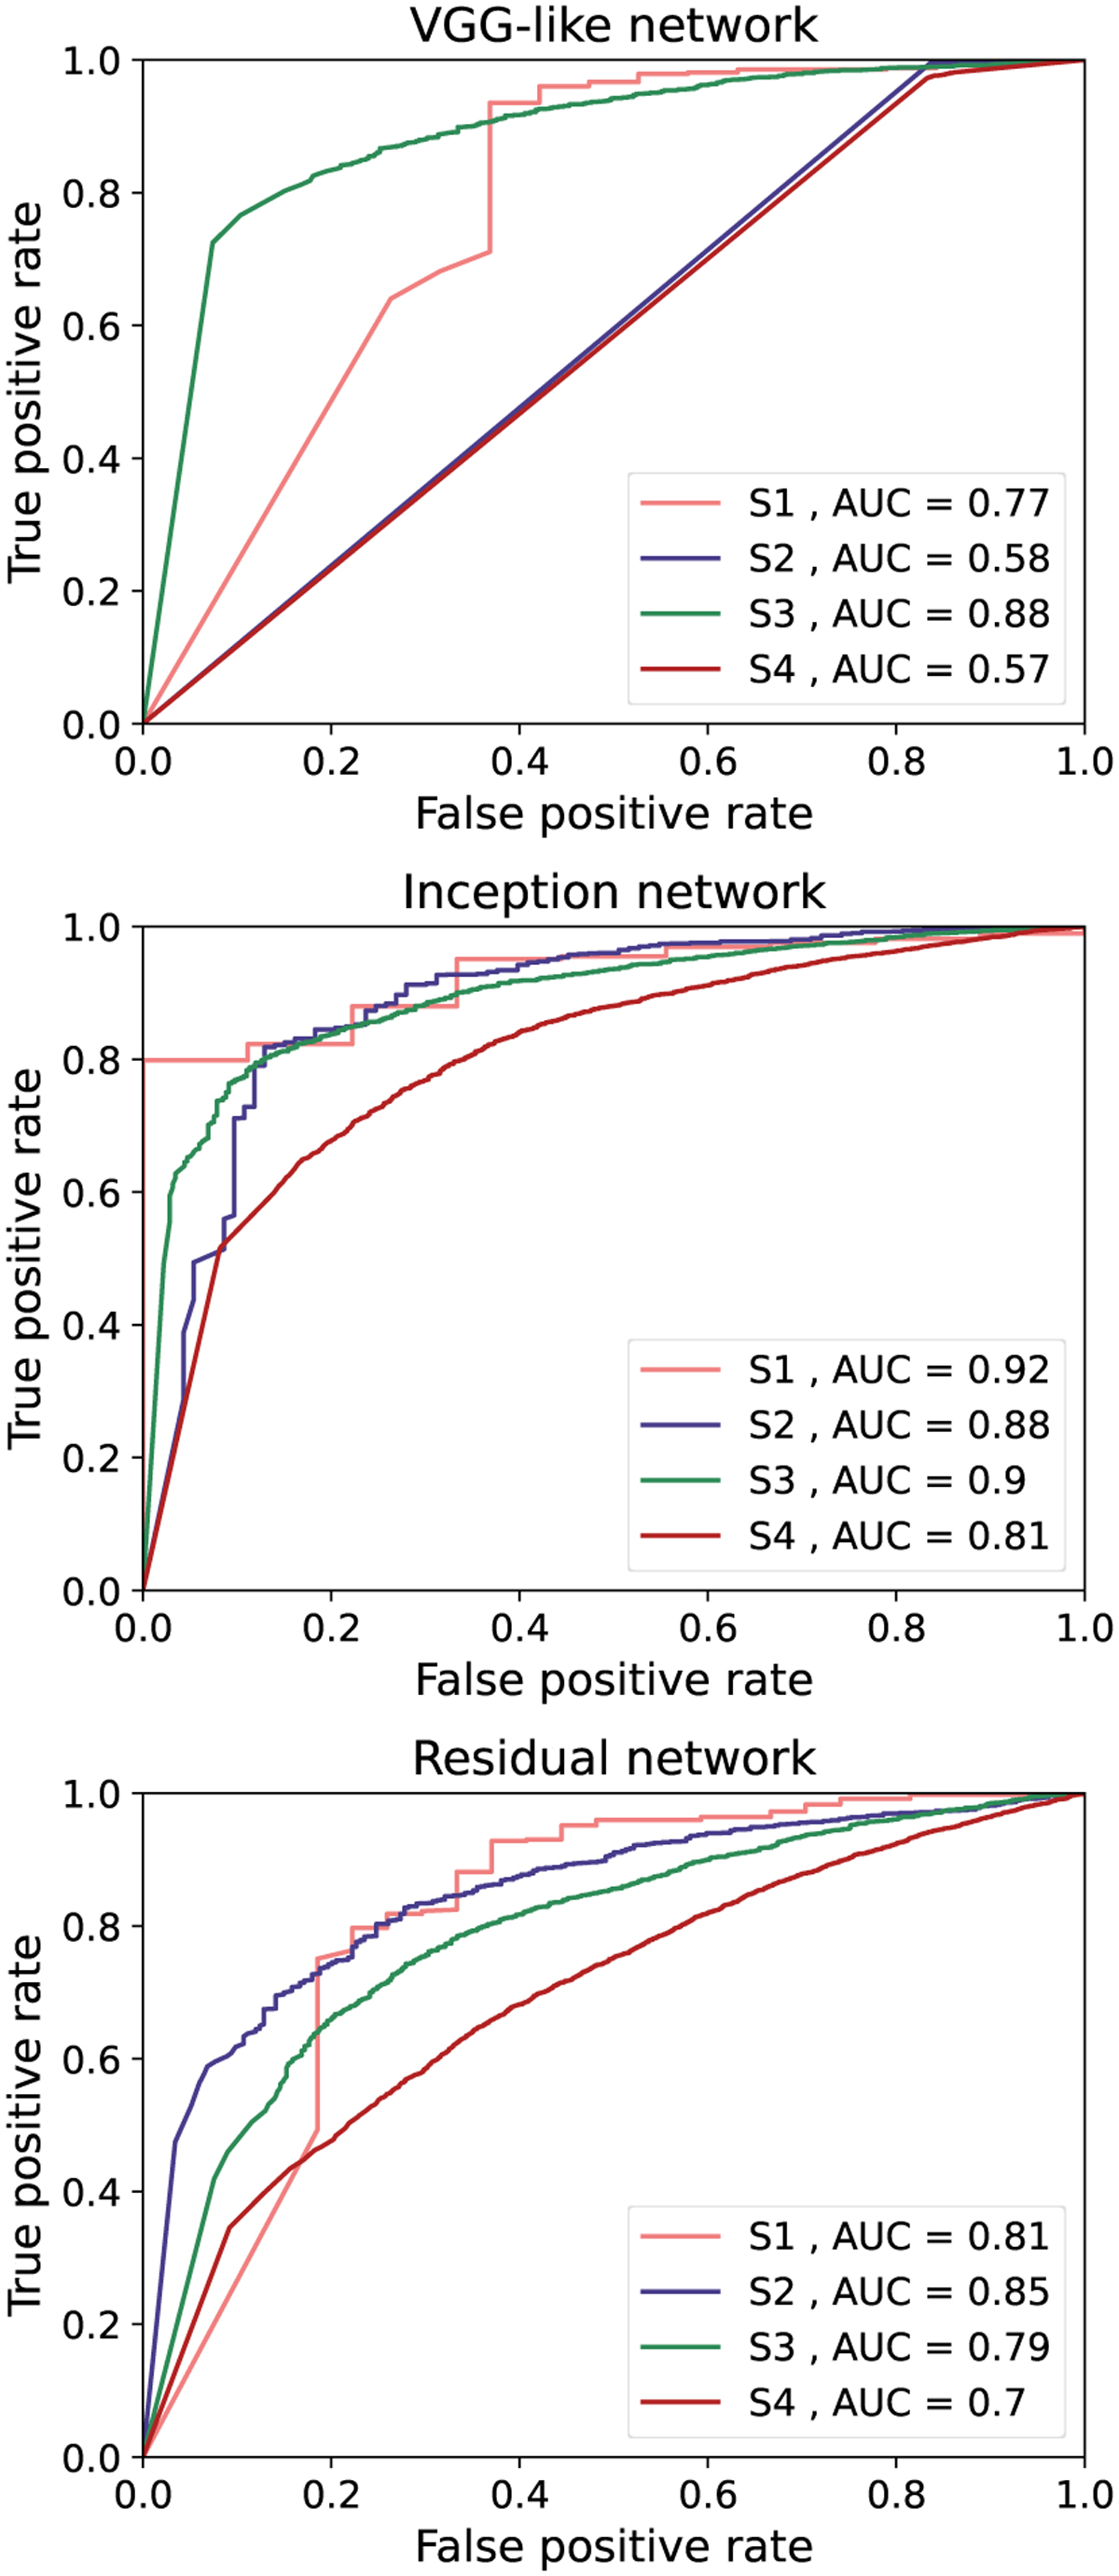
ROC curves as obtained from the tests of the single-branch versions of our architectures. From top to bottom, each panel of this image shows the ROC curves of the VGG-like network, the IncNet, and the ResNet to the test sets of the different selections S1 (pink line), S2 (blue line), S3 (green line) and S4 (red line) of the data set.
Current usage metrics show cumulative count of Article Views (full-text article views including HTML views, PDF and ePub downloads, according to the available data) and Abstracts Views on Vision4Press platform.
Data correspond to usage on the plateform after 2015. The current usage metrics is available 48-96 hours after online publication and is updated daily on week days.
Initial download of the metrics may take a while.