Open Access
Fig. 4
Download original image
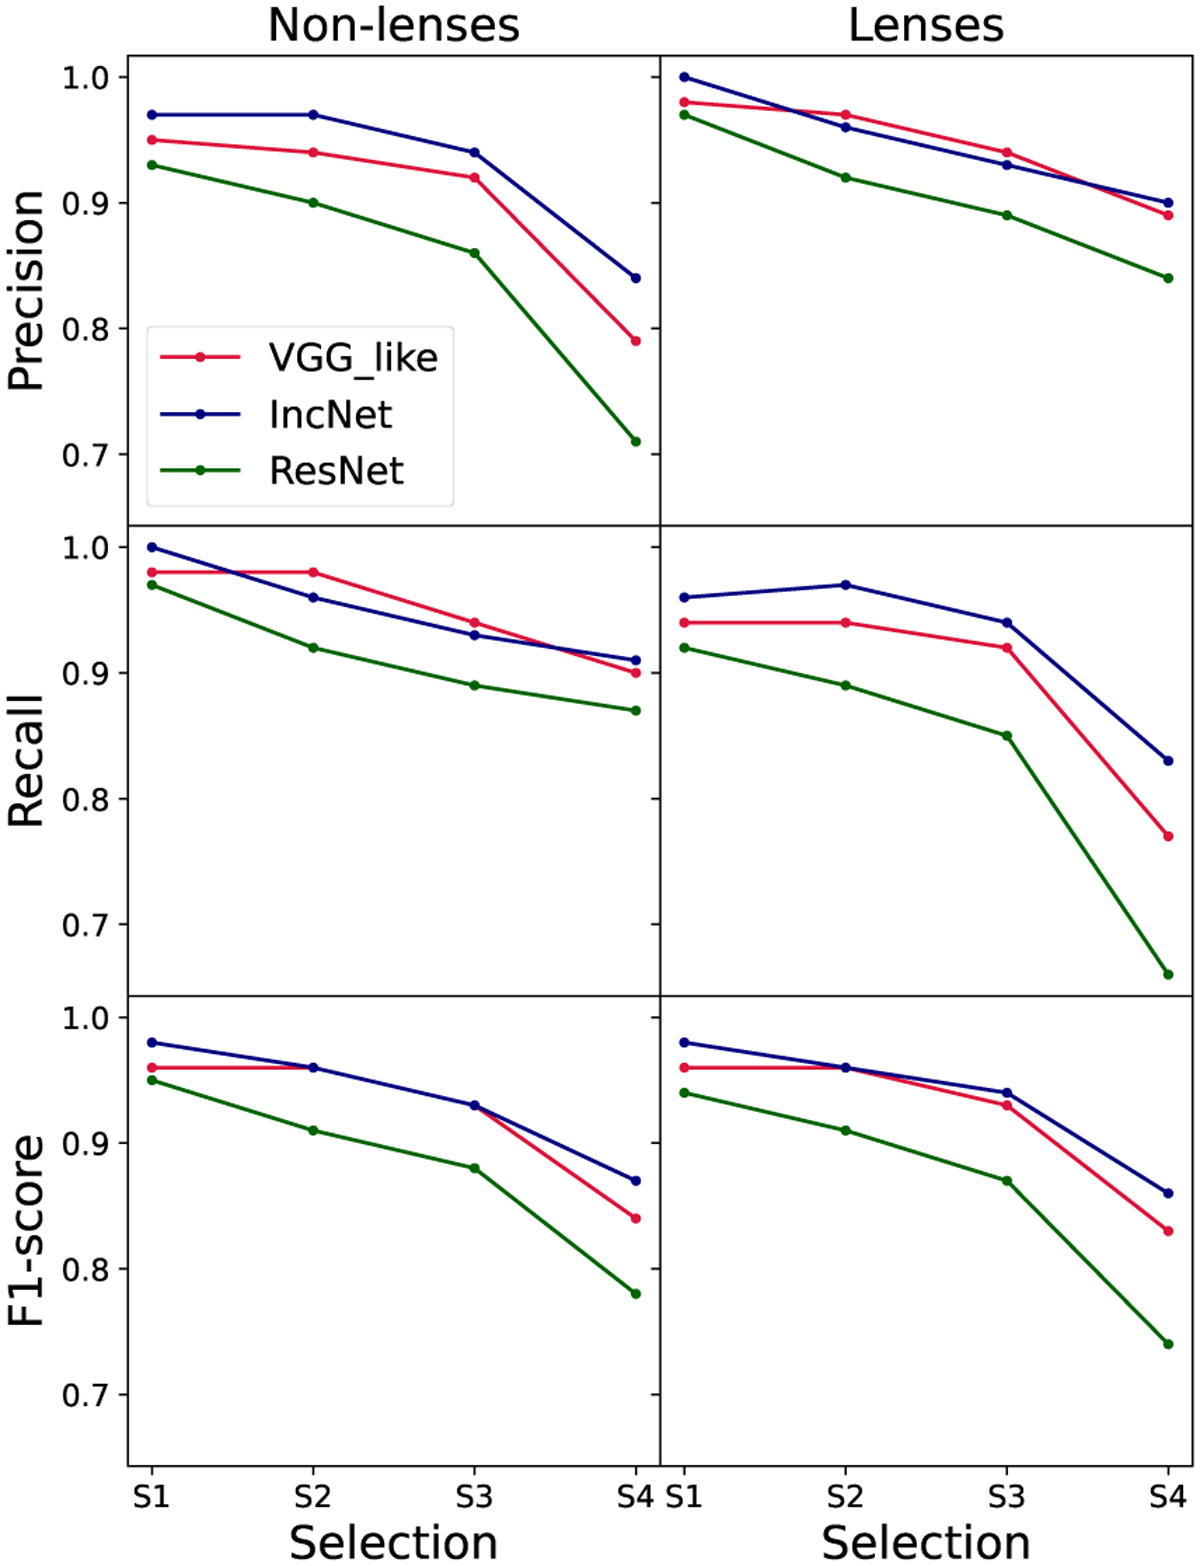
Trend of the precision (first row), recall (second row), and F1-score (third row) in the classification of the nonlenses (left column) and of the lenses (right column) in the different selections. Differently colored lines refer to different networks, as labeled, in the single-branch configuration.
Current usage metrics show cumulative count of Article Views (full-text article views including HTML views, PDF and ePub downloads, according to the available data) and Abstracts Views on Vision4Press platform.
Data correspond to usage on the plateform after 2015. The current usage metrics is available 48-96 hours after online publication and is updated daily on week days.
Initial download of the metrics may take a while.