Fig. 4.
Download original image
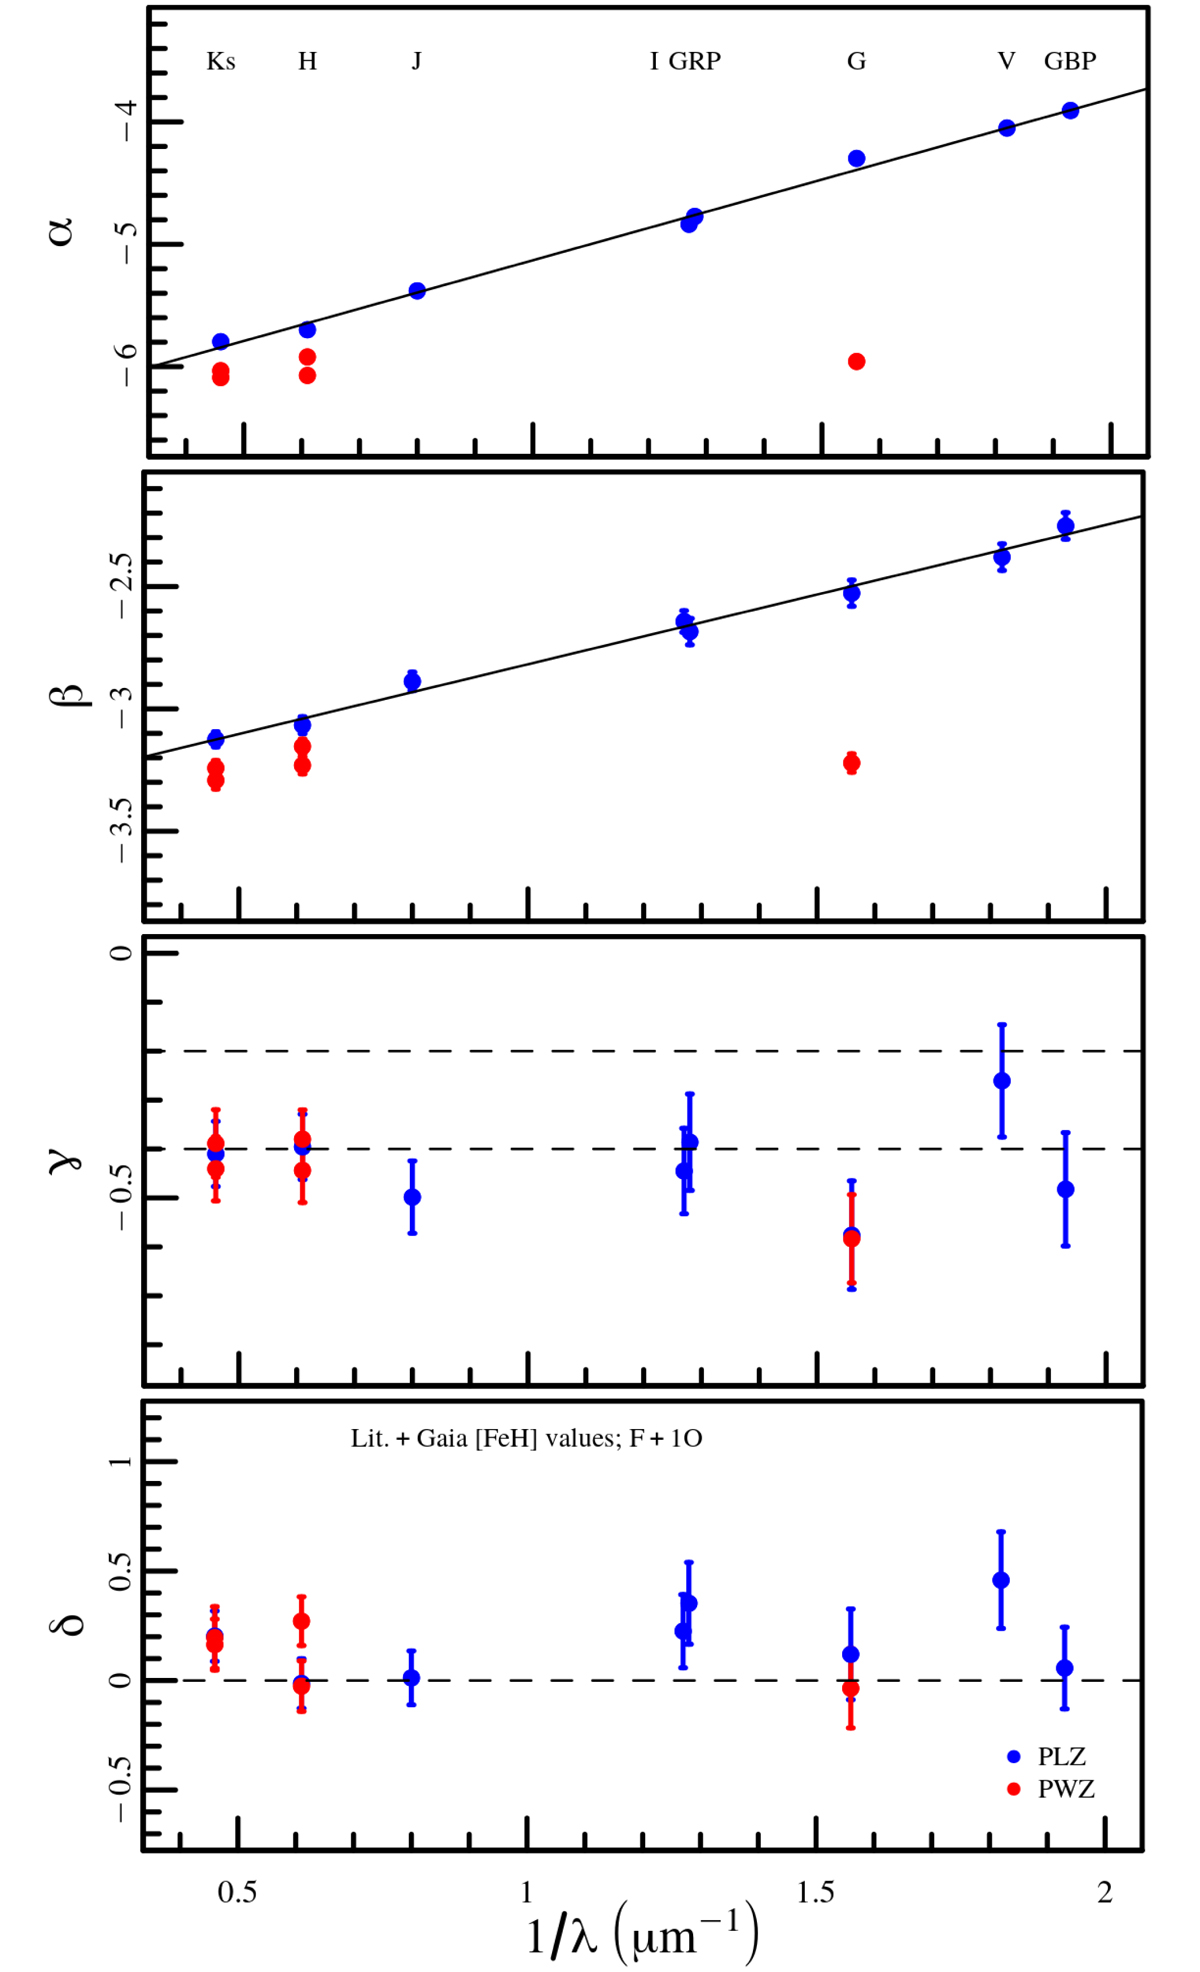
Coefficients of PLZ/PWZ relations obtained from the fit to the Lit.+Gaia sample plotted against the λ−1 parameter. From top to bottom, the panels correspond to the α, β, γ, and δ coefficients. In each panel, PLZ and PWZ coefficients are plotted with blue and red symbols respectively, while the solid line shows the linear fit only for the PLZ relations. Grey dashed lines in the γ panel delimit the range of results in the literature (−0.2 to −0.4 mag dex−1, see Breuval et al. 2022, and Sect. 5.4), while in the δ panel, it corresponds to the value 0.
Current usage metrics show cumulative count of Article Views (full-text article views including HTML views, PDF and ePub downloads, according to the available data) and Abstracts Views on Vision4Press platform.
Data correspond to usage on the plateform after 2015. The current usage metrics is available 48-96 hours after online publication and is updated daily on week days.
Initial download of the metrics may take a while.