Fig. 19.
Download original image
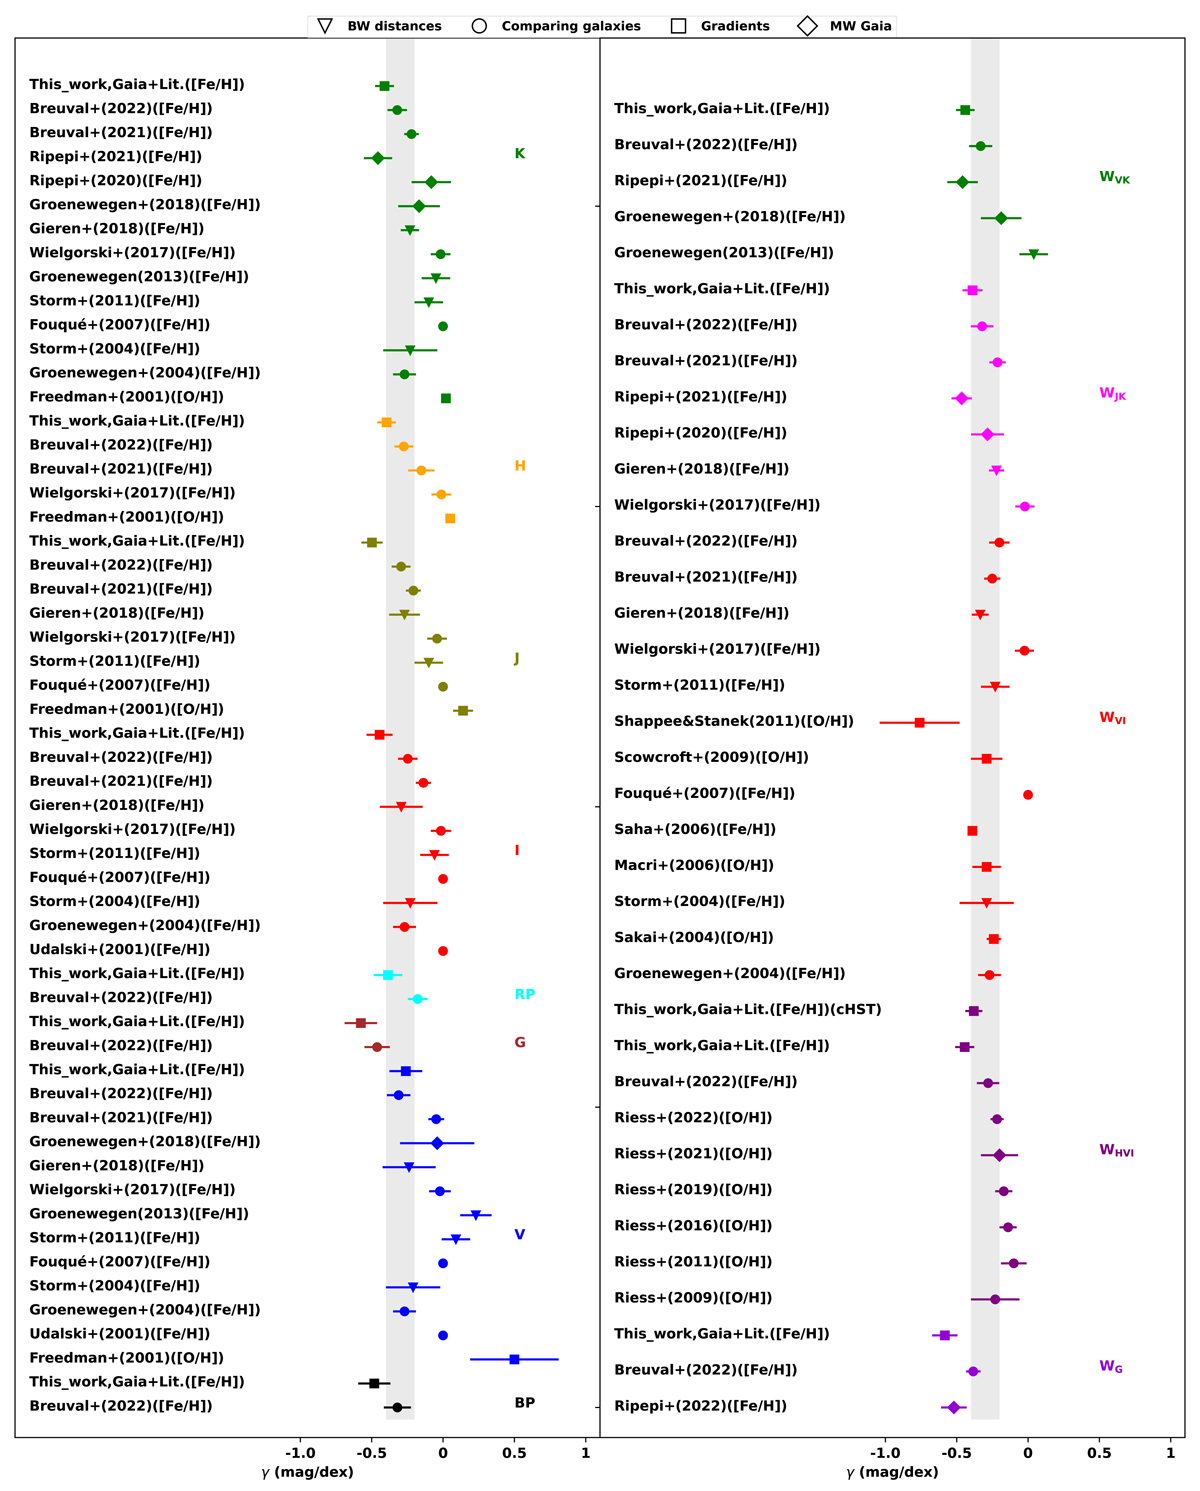
Literature estimation of the γ coefficient for PLZ (left panel) and PWZ (right panel) relations over the last 20 years. Bands are divided by colour and sorted by year of publication from bottom to top. Symbols correspond to the method used to derive the metallicity coefficient. The vertical shaded region corresponds to the range of intervals between −0.4 and −0.2 mag dex−1 (see text for detail). For the complete list of sources, see Fig. 1 from Romaniello et al. (2008) and Table 1 from Breuval et al. (2022).
Current usage metrics show cumulative count of Article Views (full-text article views including HTML views, PDF and ePub downloads, according to the available data) and Abstracts Views on Vision4Press platform.
Data correspond to usage on the plateform after 2015. The current usage metrics is available 48-96 hours after online publication and is updated daily on week days.
Initial download of the metrics may take a while.