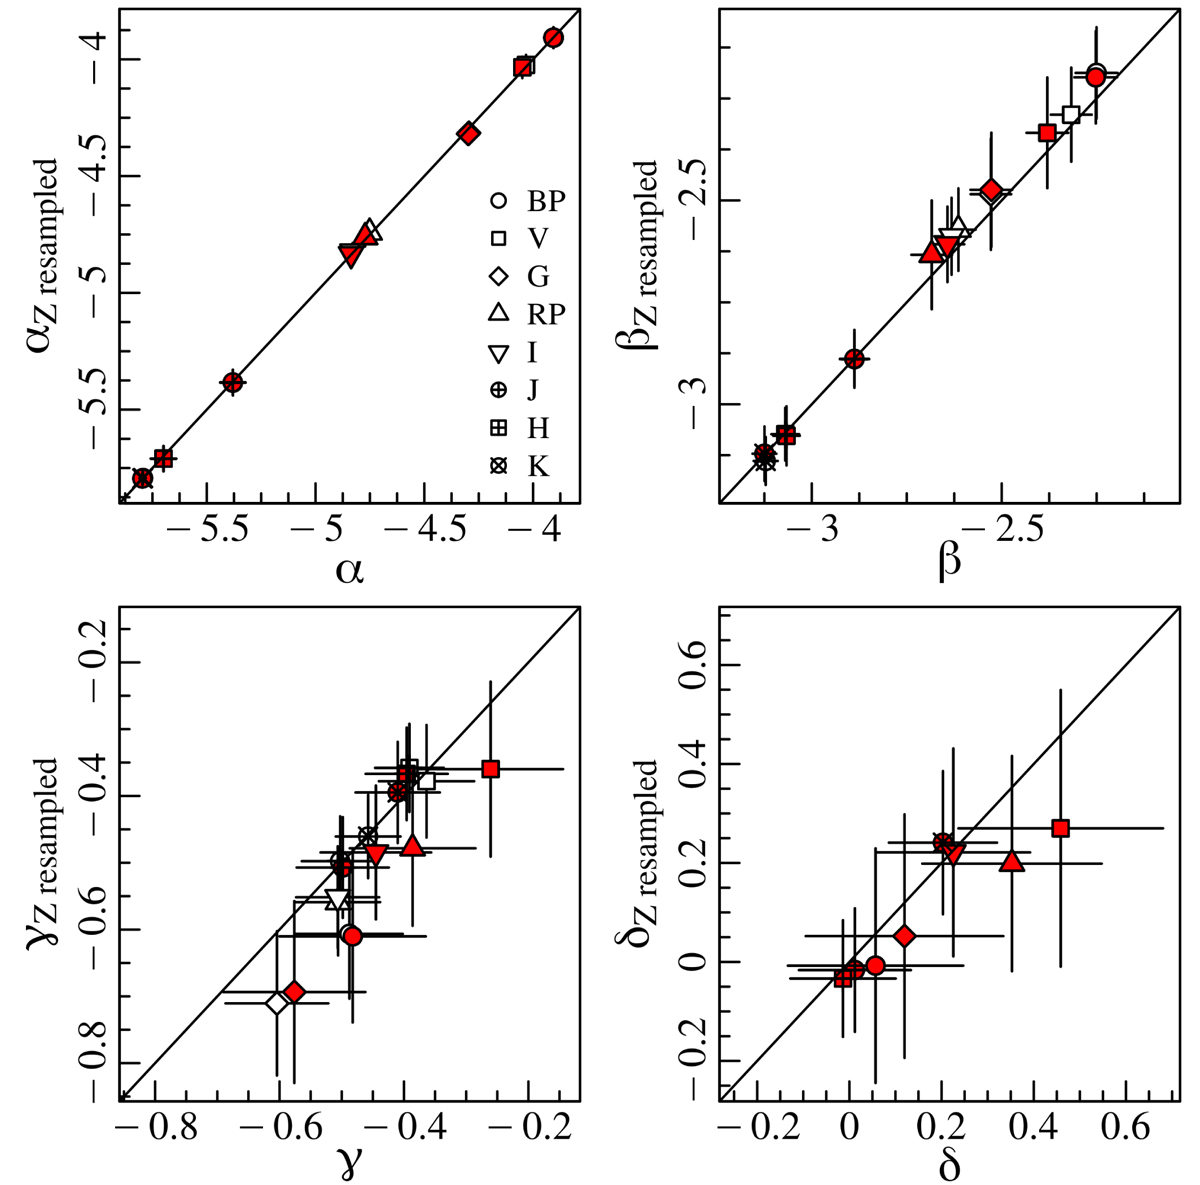
Fig. 17.
Download original image
Comparison between the PLZ coefficients obtained with the resampling in metallicity with those obtained using the entire data set. From top-left to bottom-right, the panels show the results for the α, β, γ, and δ coefficients, respectively. For each coefficient, different photometric bands are plotted using different symbols, as labelled in the top-left panel. In contrast, red-filled and white-filled symbols indicate the fit results including or excluding the δ parameter, respectively.
Current usage metrics show cumulative count of Article Views (full-text article views including HTML views, PDF and ePub downloads, according to the available data) and Abstracts Views on Vision4Press platform.
Data correspond to usage on the plateform after 2015. The current usage metrics is available 48-96 hours after online publication and is updated daily on week days.
Initial download of the metrics may take a while.