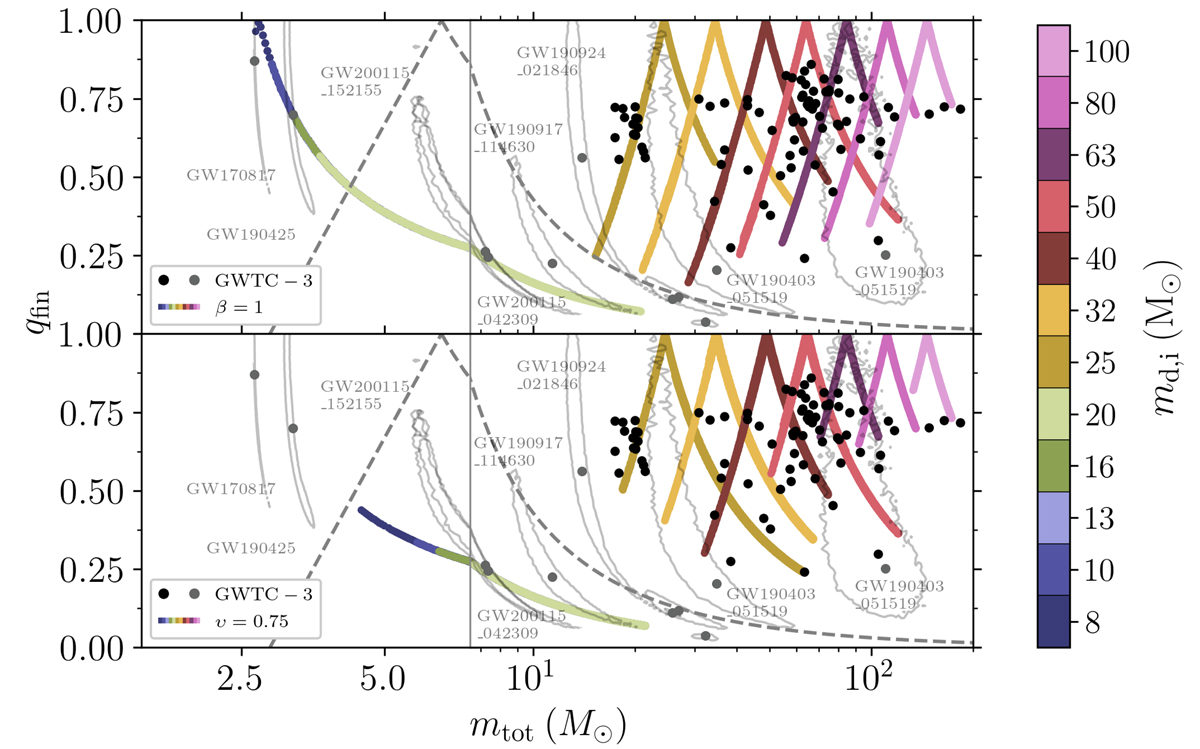
Fig. 16.
Download original image
Plane of final mass ratio qfin < 1 and total final mass, mtot. We report the estimation values with corresponding 90% credible intervals for the GWTC-3 signal (gray/black dots) and the posterior 90% iso-contour for a selection of those (gray dots and light gray curves). Resulting final mass ratios and total mass from our treatment are reported with color coding referring to different donor masses md, i in the simulation grid from Ge et al. series Ge et al. (2020), 2015, 2010). The assumption of completely non-conservative, purely isotropic re-emission, β = 1, channel is adopted in the top panel, while the bottom panel shows the results when switching on an efficiency for L2 mass outflow of υ = 0.75. Solid gray, dashed lines delineate regions where the primary and secondary can have a mass below 3 M⊙, and where both objects in the binary have masses above 3 M⊙.
Current usage metrics show cumulative count of Article Views (full-text article views including HTML views, PDF and ePub downloads, according to the available data) and Abstracts Views on Vision4Press platform.
Data correspond to usage on the plateform after 2015. The current usage metrics is available 48-96 hours after online publication and is updated daily on week days.
Initial download of the metrics may take a while.