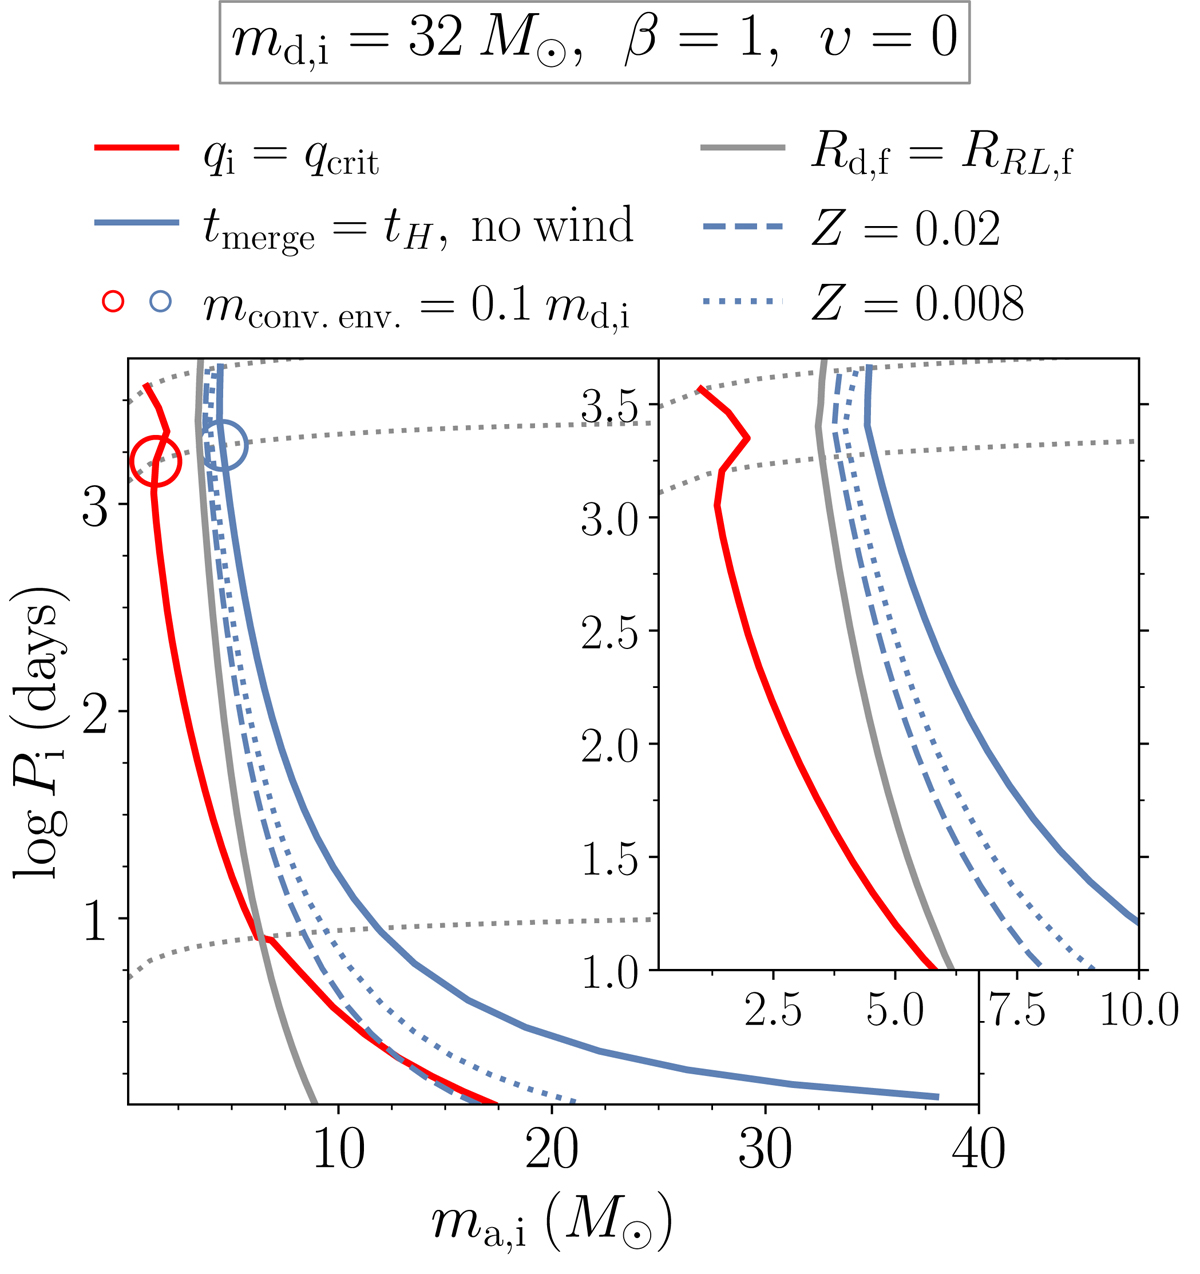
Fig. 12.
Download original image
Same as Fig. 5, but illustrating the impact of wind mass loss after the phase of stable MT. The dashed (dotted) blue line shows the modified delay time boundary (solid blue) due to wind mass loss effects, in an environment with Z = 0.02 (Z = 0.008), on the post-MT mass of the stripped star and on the orbital separation at the start of the inspiral phase (see text in Sect. 3.4 for more details). It is important to note that we are considering the effect under the isotropic re-emission β = 1 assumption on the MT episode. For the rest, analogous symbols and notation to Fig. 5 are employed.
Current usage metrics show cumulative count of Article Views (full-text article views including HTML views, PDF and ePub downloads, according to the available data) and Abstracts Views on Vision4Press platform.
Data correspond to usage on the plateform after 2015. The current usage metrics is available 48-96 hours after online publication and is updated daily on week days.
Initial download of the metrics may take a while.