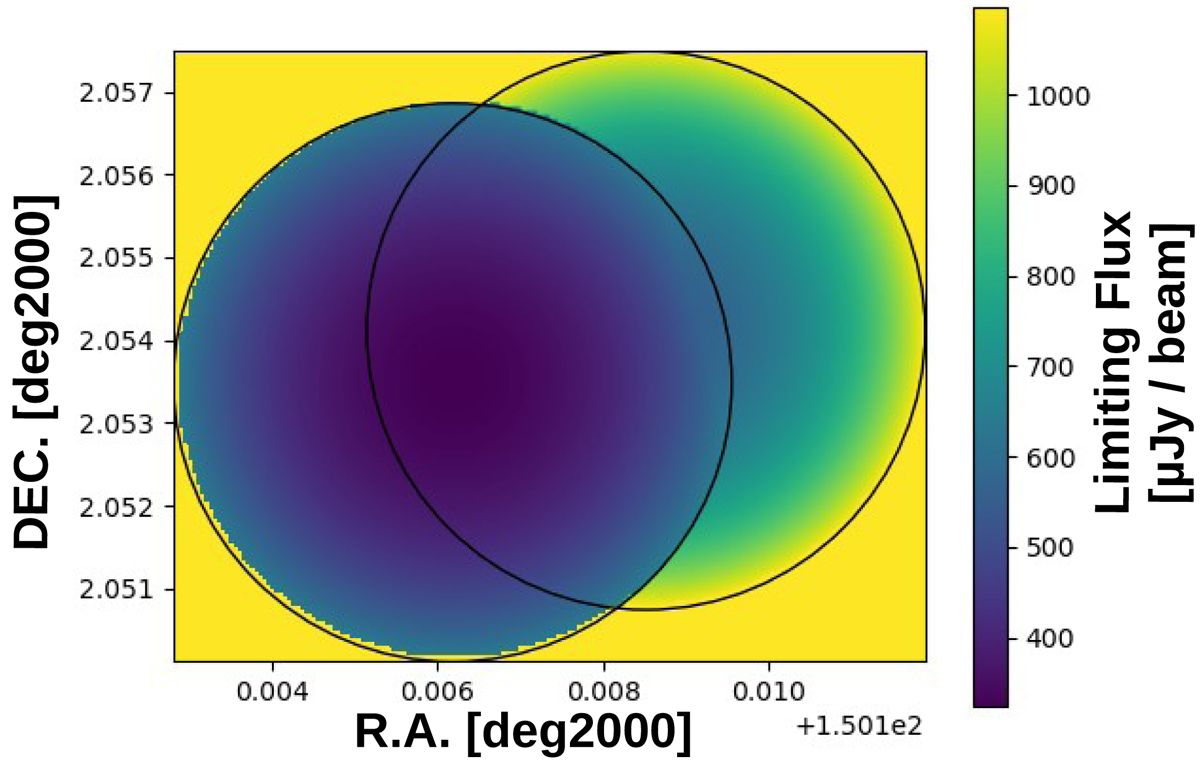
Fig. 8.
Download original image
Two overlapping pointings in band 6. The black circle represents the adopted primary beam size (out to a pbcor of 0.2), color-coded by the inferred RMS. Lower RMS values are represented by darker colors and higher values by lighter ones. Outside our primary beam boundary, we set values to the arbitrary high value of 106 μJy. In these types of cases, we adopted the area from the deepest pointing in the overlapping region.
Current usage metrics show cumulative count of Article Views (full-text article views including HTML views, PDF and ePub downloads, according to the available data) and Abstracts Views on Vision4Press platform.
Data correspond to usage on the plateform after 2015. The current usage metrics is available 48-96 hours after online publication and is updated daily on week days.
Initial download of the metrics may take a while.