Open Access
Fig. 6.
Download original image
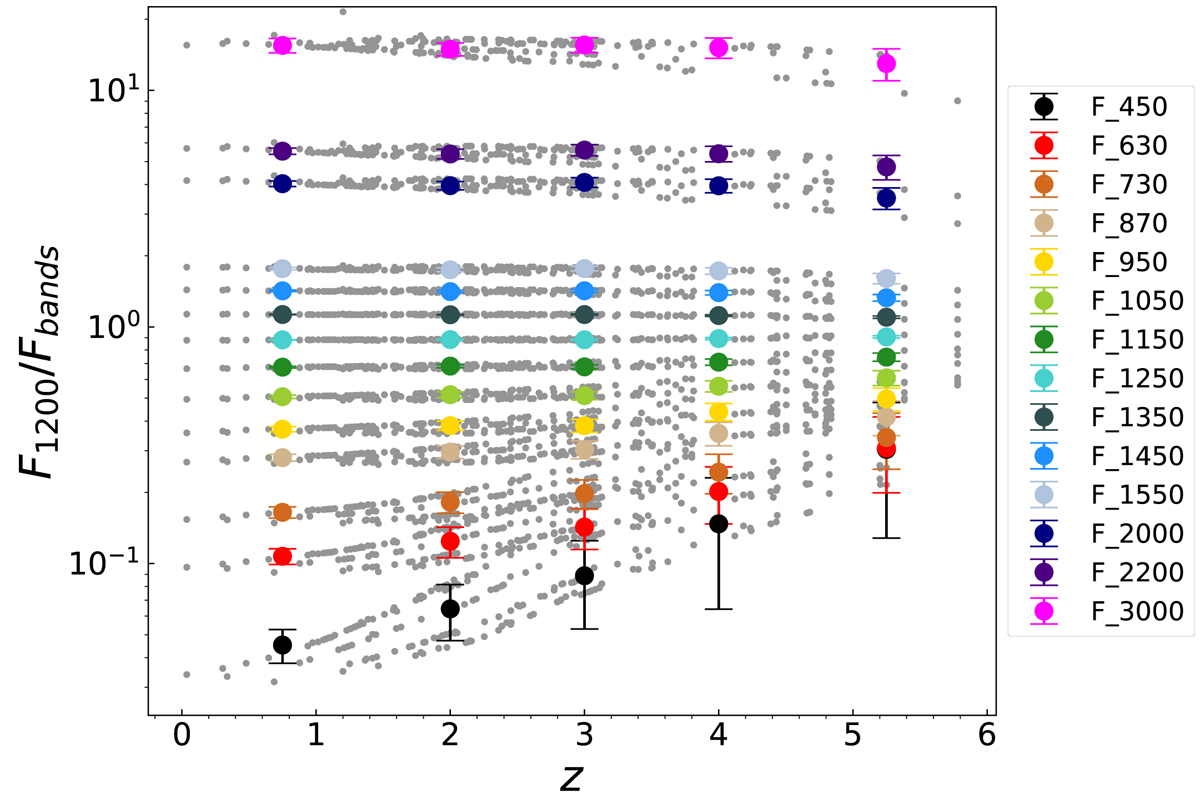
Ratio between the flux at 1200 μm and other bands against redshift. The gray circles in the background indicate the values for individual sources in each band, while the colored circles refer to the median values in each redshift bin and for each ALMA band, as described in Sect. 4.2.
Current usage metrics show cumulative count of Article Views (full-text article views including HTML views, PDF and ePub downloads, according to the available data) and Abstracts Views on Vision4Press platform.
Data correspond to usage on the plateform after 2015. The current usage metrics is available 48-96 hours after online publication and is updated daily on week days.
Initial download of the metrics may take a while.