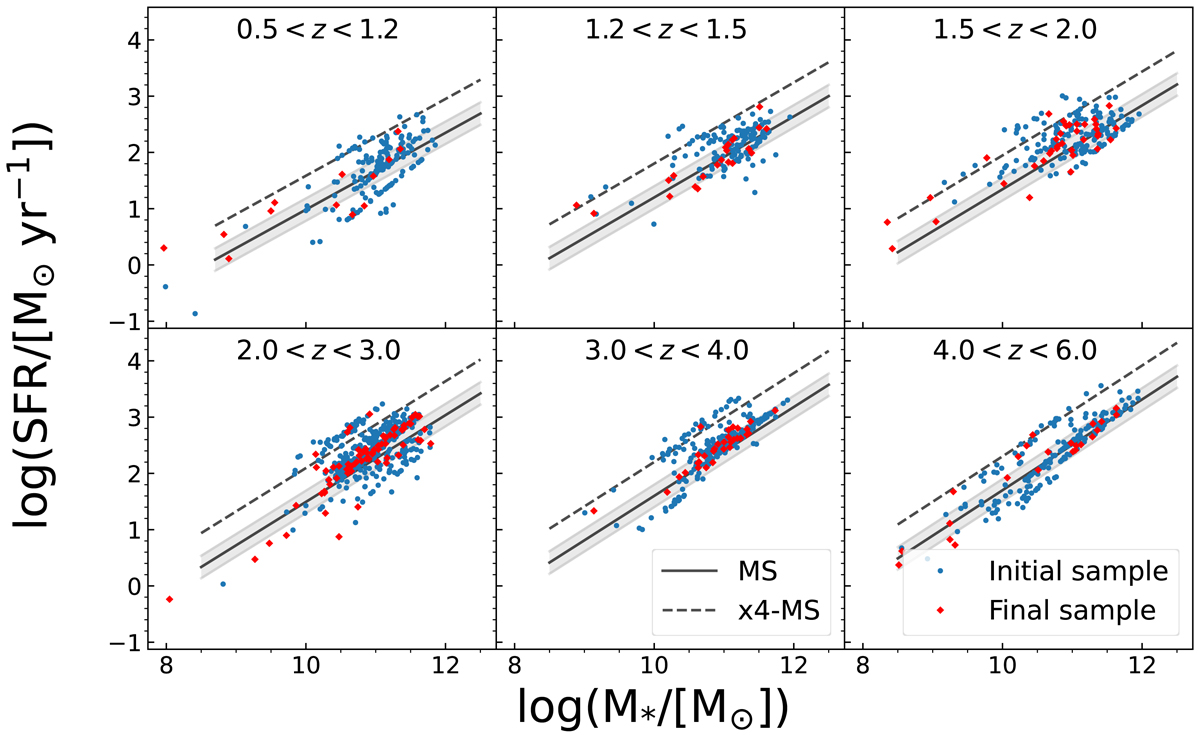
Fig. 5.
Download original image
Main sequence of galaxies computed in six different redshift bins: 0.5–1.2, 1.2–1.5, 1.5–2.0, 2.0–3.0, 3.0–4.0, 4.0–6.0. Data of the full sample are reported as blue circles, while the red diamonds represent the final sample (Sect. 4.4) used in our analysis. The black solid line and shaded area indicate the main sequence Speagle et al. (2014; computed at the mean values of the redshift bins) and 1σ dispersion. Finally, the black dashed lines represent the 4x MS, indicative of the starburst regime.
Current usage metrics show cumulative count of Article Views (full-text article views including HTML views, PDF and ePub downloads, according to the available data) and Abstracts Views on Vision4Press platform.
Data correspond to usage on the plateform after 2015. The current usage metrics is available 48-96 hours after online publication and is updated daily on week days.
Initial download of the metrics may take a while.