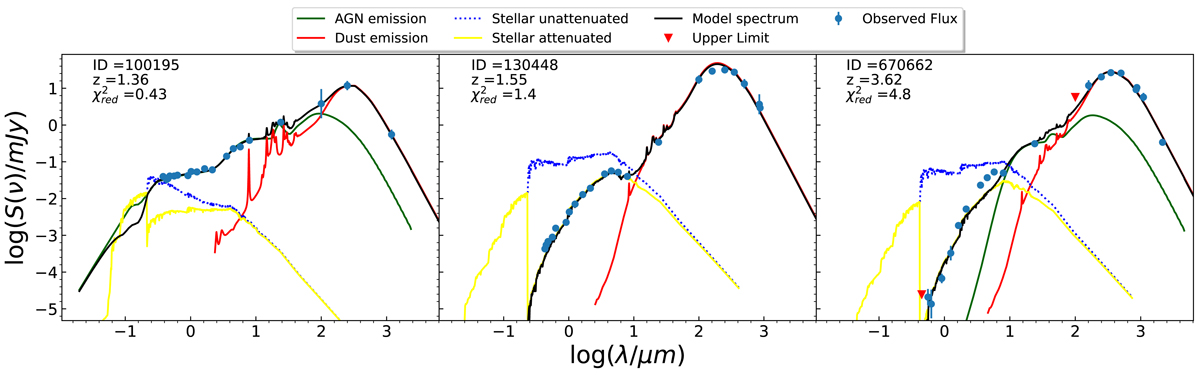
Fig. 3.
Download original image
Examples of SED-fitting results for three different classes of objects. From left to right: Unobscured AGN SED, SED without an AGN contribution, and obscured AGN component. The blue circles and the red triangles represent data points and upper limits, respectively. The best-fit model is plotted as a black solid line. The stellar attenuated and unattenuated, the dust emission, and the AGN emission are respectively reported as a yellow solid line, a blue dashed line, a red solid line, and a green solid line.
Current usage metrics show cumulative count of Article Views (full-text article views including HTML views, PDF and ePub downloads, according to the available data) and Abstracts Views on Vision4Press platform.
Data correspond to usage on the plateform after 2015. The current usage metrics is available 48-96 hours after online publication and is updated daily on week days.
Initial download of the metrics may take a while.