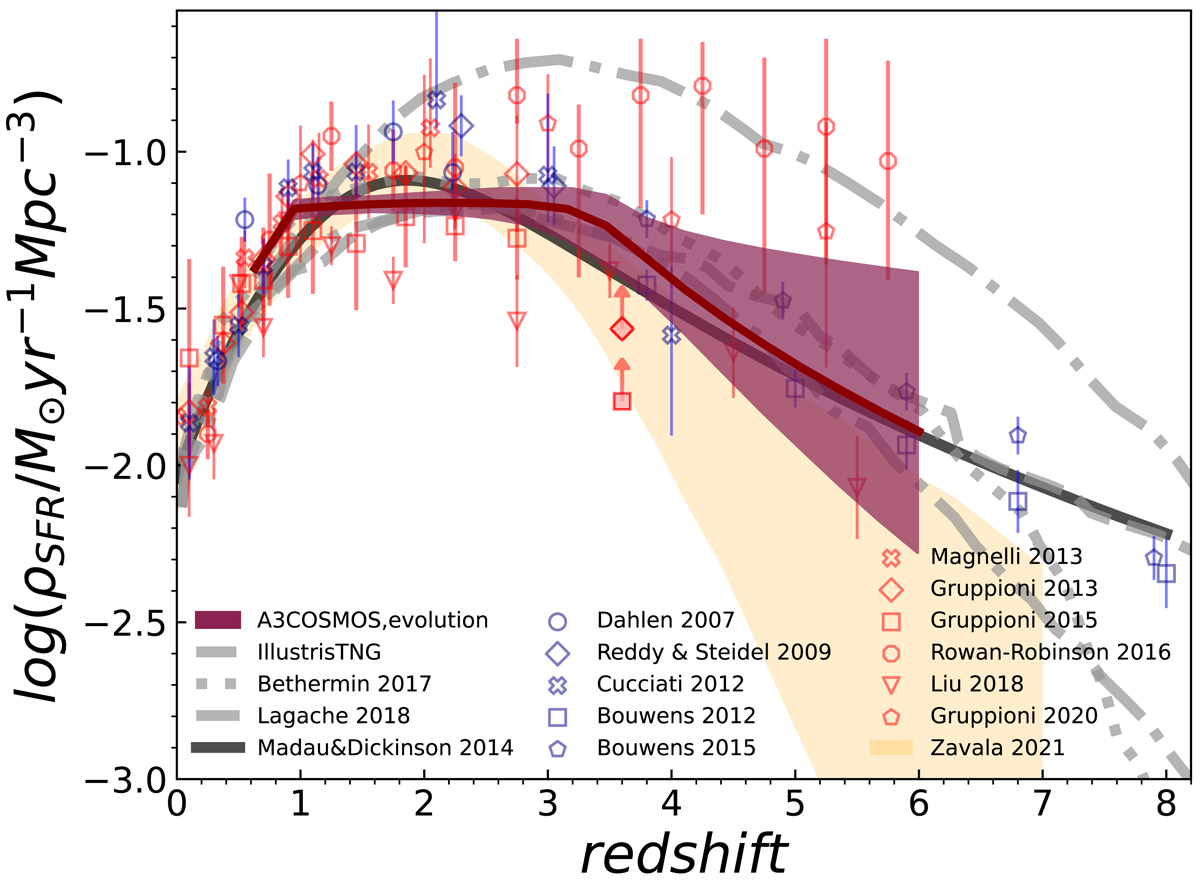
Fig. 14.
Download original image
Co-moving SFRD evolution with z. The red diamonds were obtained through the integration of the LF best-fit in each z bin, while the dark-red shaded area was obtained by integrating the evolutionary LF from z= 0.5 to 6. Comparison curves from the literature are reported as gray dash-dotted (pessimistic and optimistic cases; Lagache 2018); dashed (IllustrisTNG), dotted (Béthermin et al. 2017), and black solid lines (Madau & Dickinson 2014). The empty red circles with different symbols represent different IR-millimeter estimates of the SFRD from Gruppioni et al. (2013, 2015, 2020), Magnelli et al. (2013), Rowan-Robinson et al. (2016), Liu et al. (2018), and the orange shaded area is the dust-obscured SFRD by Zavala et al. (2021), from the MORA survey. The SFRD from the UV is plotted as empty blue circles with different markers (Dahlen et al. 2007; Reddy & Steidel 2009; Cucciati et al. 2012; Bouwens et al. 2012, 2015).
Current usage metrics show cumulative count of Article Views (full-text article views including HTML views, PDF and ePub downloads, according to the available data) and Abstracts Views on Vision4Press platform.
Data correspond to usage on the plateform after 2015. The current usage metrics is available 48-96 hours after online publication and is updated daily on week days.
Initial download of the metrics may take a while.