Fig. 13.
Download original image
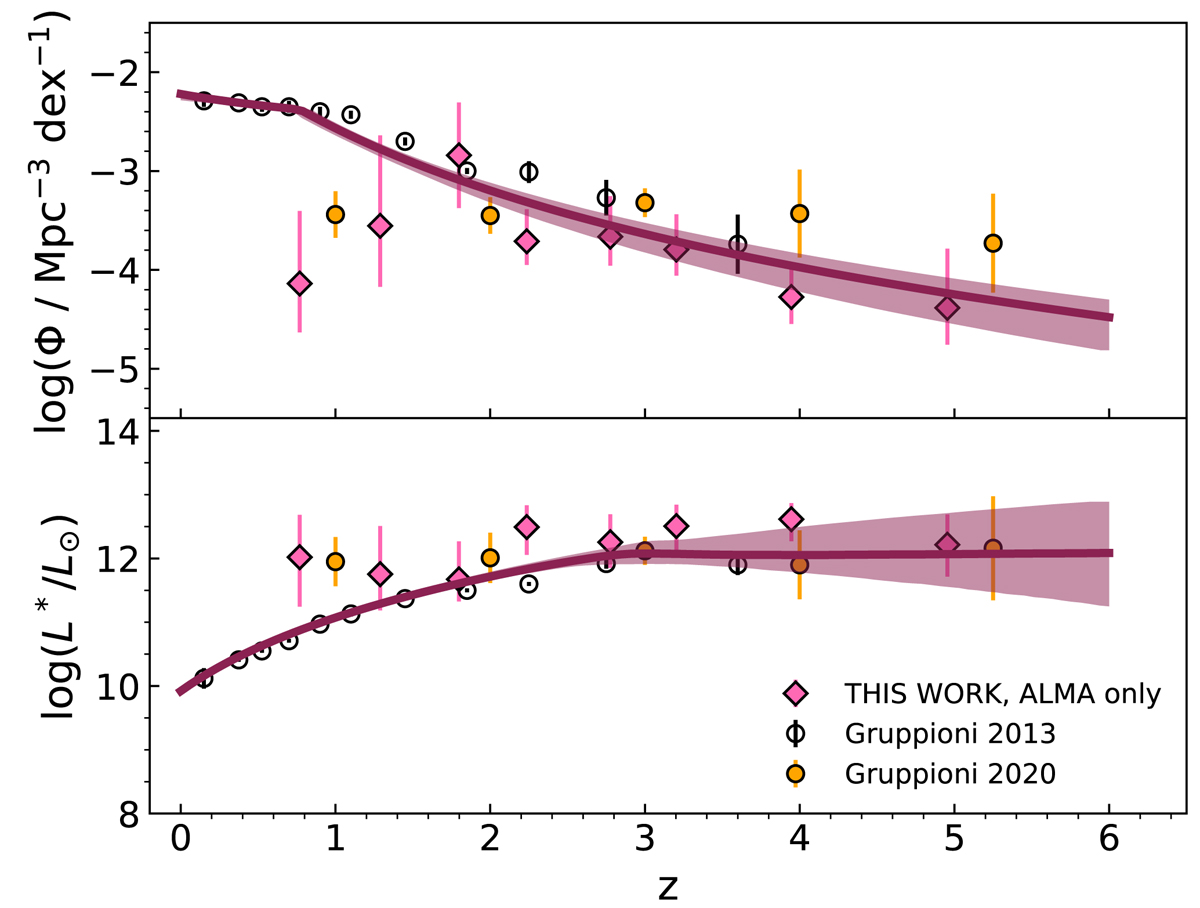
Evolutionary trends of Φ* (top panel) and L* (bottom panel) with redshift. The solid dark-red lines and shaded areas show the behaviors of Φ* and L* at all the redshifts, while the pink diamonds are the estimates obtained when fitting each redshift bin individually in the ALMA-only case. Finally, the empty black circles and yellow circles represent estimates for L* and Φ* from Gruppioni et al. (2013, 2020), which we include for comparison.
Current usage metrics show cumulative count of Article Views (full-text article views including HTML views, PDF and ePub downloads, according to the available data) and Abstracts Views on Vision4Press platform.
Data correspond to usage on the plateform after 2015. The current usage metrics is available 48-96 hours after online publication and is updated daily on week days.
Initial download of the metrics may take a while.