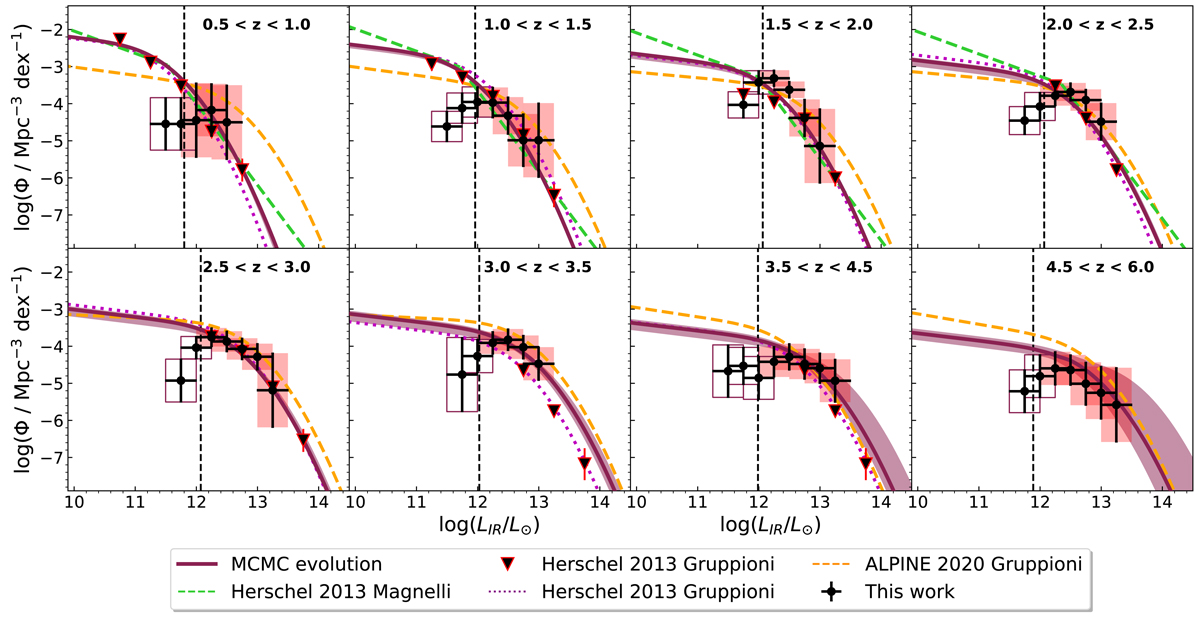
Fig. 12.
Download original image
A3COSMOS (red boxes and black circles) + Herschel (black triangles) luminosity function. The dark-red lines and shaded areas are the best fit obtained by using all the LF points from different z-bins together. The redshift ranges are reported in the upper-right corner of each subplot, while the luminosity bins are centered at each 0.25 dex, with a width of 0.5 dex (overlapping bins). The black vertical dashed lines represent the completeness limit of the LIR. The orange dashed, purple dotted, and green dashed lines are the best-fit LFs obtained by Gruppioni et al. (2013, 2020), Magnelli et al. (2013).
Current usage metrics show cumulative count of Article Views (full-text article views including HTML views, PDF and ePub downloads, according to the available data) and Abstracts Views on Vision4Press platform.
Data correspond to usage on the plateform after 2015. The current usage metrics is available 48-96 hours after online publication and is updated daily on week days.
Initial download of the metrics may take a while.