Fig. 4
Download original image
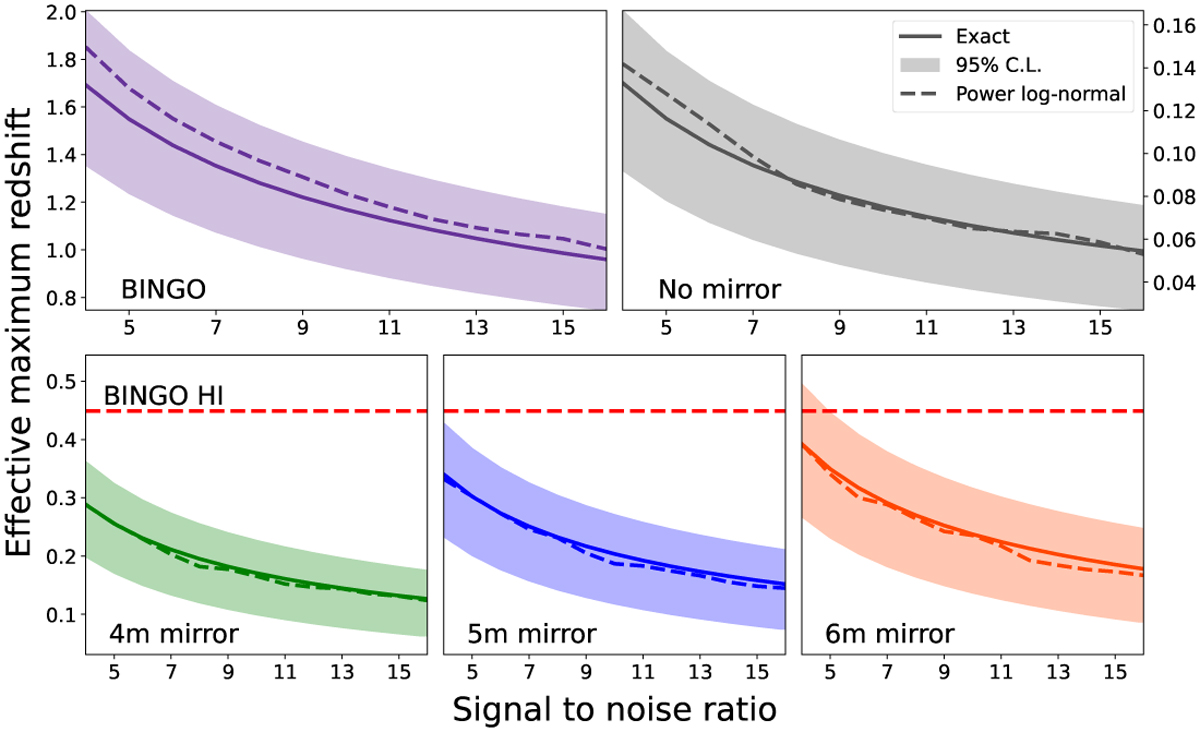
Maximum effective redshift for different BINGO configurations varying from S/N ≥ 5 to S/N ≥ 15. When comparing the exact solution from sensitivity maps (solid lines) with the fitted power log-normal distribution (dashed lines), we note that they are in agreement with the exact solution in 95% C.L. (shaded regions). The red dashed line shows the maximum redshift of the BINGO HI survey.
Current usage metrics show cumulative count of Article Views (full-text article views including HTML views, PDF and ePub downloads, according to the available data) and Abstracts Views on Vision4Press platform.
Data correspond to usage on the plateform after 2015. The current usage metrics is available 48-96 hours after online publication and is updated daily on week days.
Initial download of the metrics may take a while.