Fig. 4.
Download original image
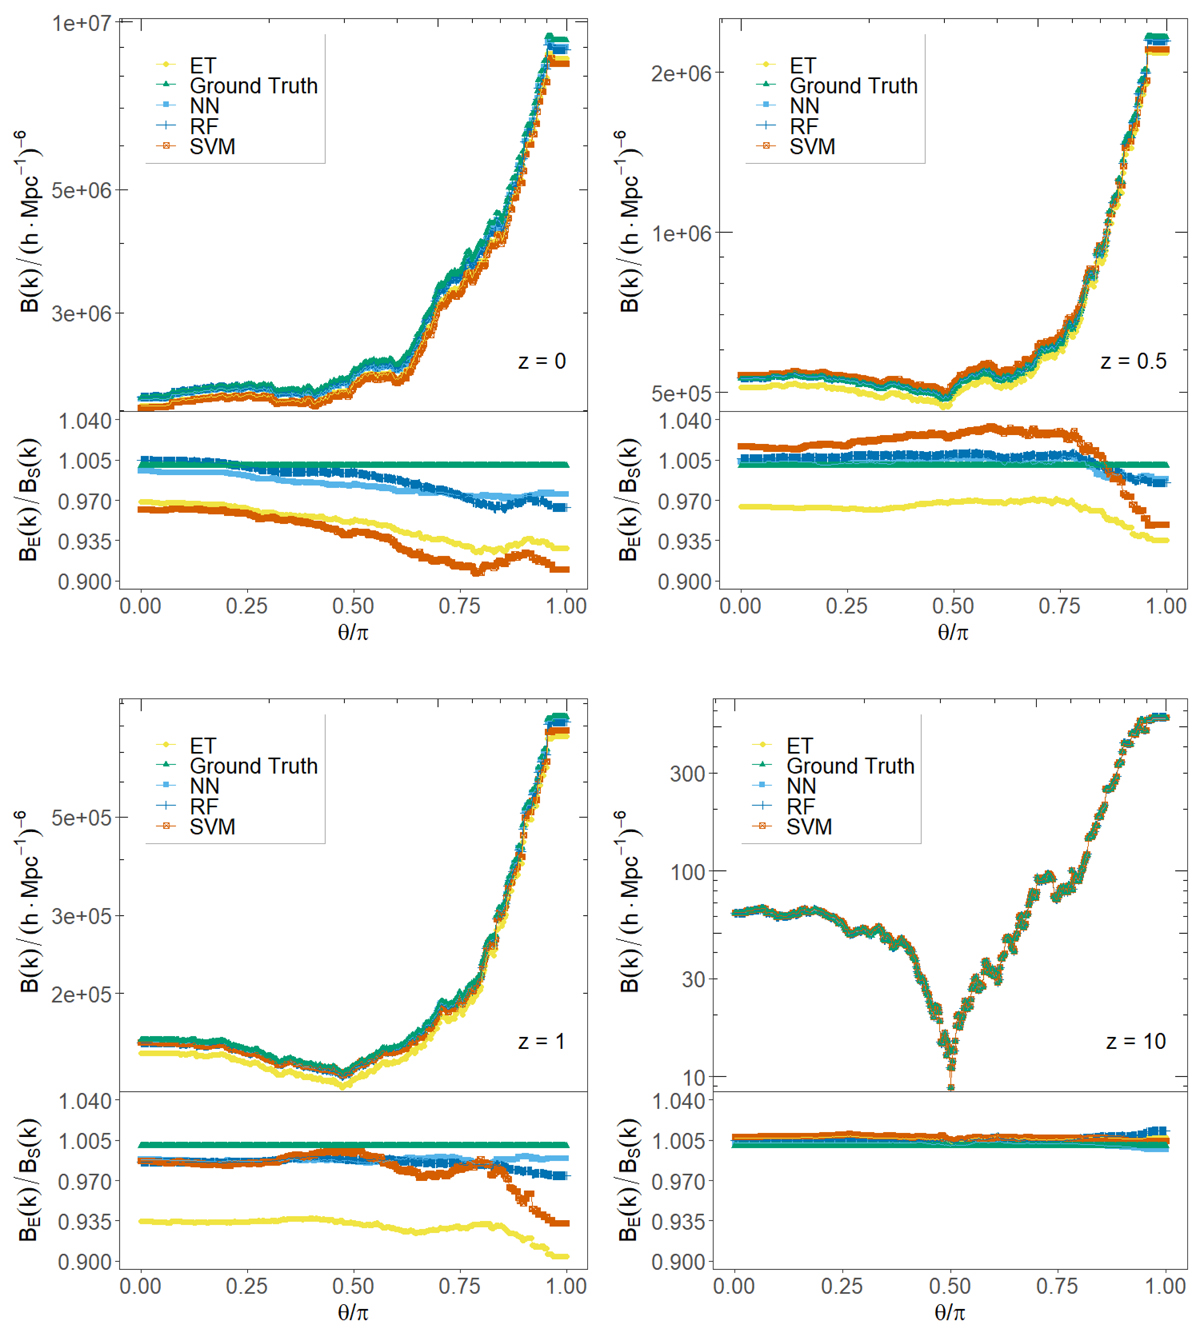
Bipectrum emulations at redshifts z = 0 (top left), z = 0.5 (top right), z = 1 (bottom left), and z = 10 (bottom right) for model regressions with a single parameter, Ωm = 0.31. The top panel of each plot shows bispectra for our different emulation variants, extremely randomized trees (ET), neural networks (NN), Random Forests (RF), and support vector machines (SVM). The bottom panel in each plot shows the bispectra ratios from emulations, BE(θ), and the BS(θ) the ground truth simulation.
Current usage metrics show cumulative count of Article Views (full-text article views including HTML views, PDF and ePub downloads, according to the available data) and Abstracts Views on Vision4Press platform.
Data correspond to usage on the plateform after 2015. The current usage metrics is available 48-96 hours after online publication and is updated daily on week days.
Initial download of the metrics may take a while.