Fig. 14.
Download original image
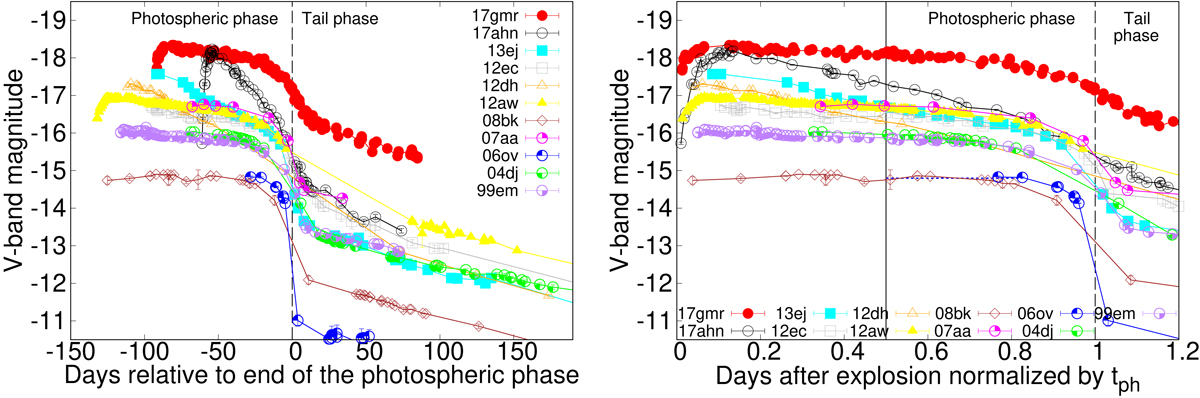
V-band light curves of our sample (left panel) and the same light curves with the time after explosion nomalized by the length of the photospheric phase (right panel). The vertical line and dashed lines indicate the timing of the middle and end of the photospheric phase, respectively. The blue dotted line is the extrapolation of the first point.
Current usage metrics show cumulative count of Article Views (full-text article views including HTML views, PDF and ePub downloads, according to the available data) and Abstracts Views on Vision4Press platform.
Data correspond to usage on the plateform after 2015. The current usage metrics is available 48-96 hours after online publication and is updated daily on week days.
Initial download of the metrics may take a while.