Fig. 5.
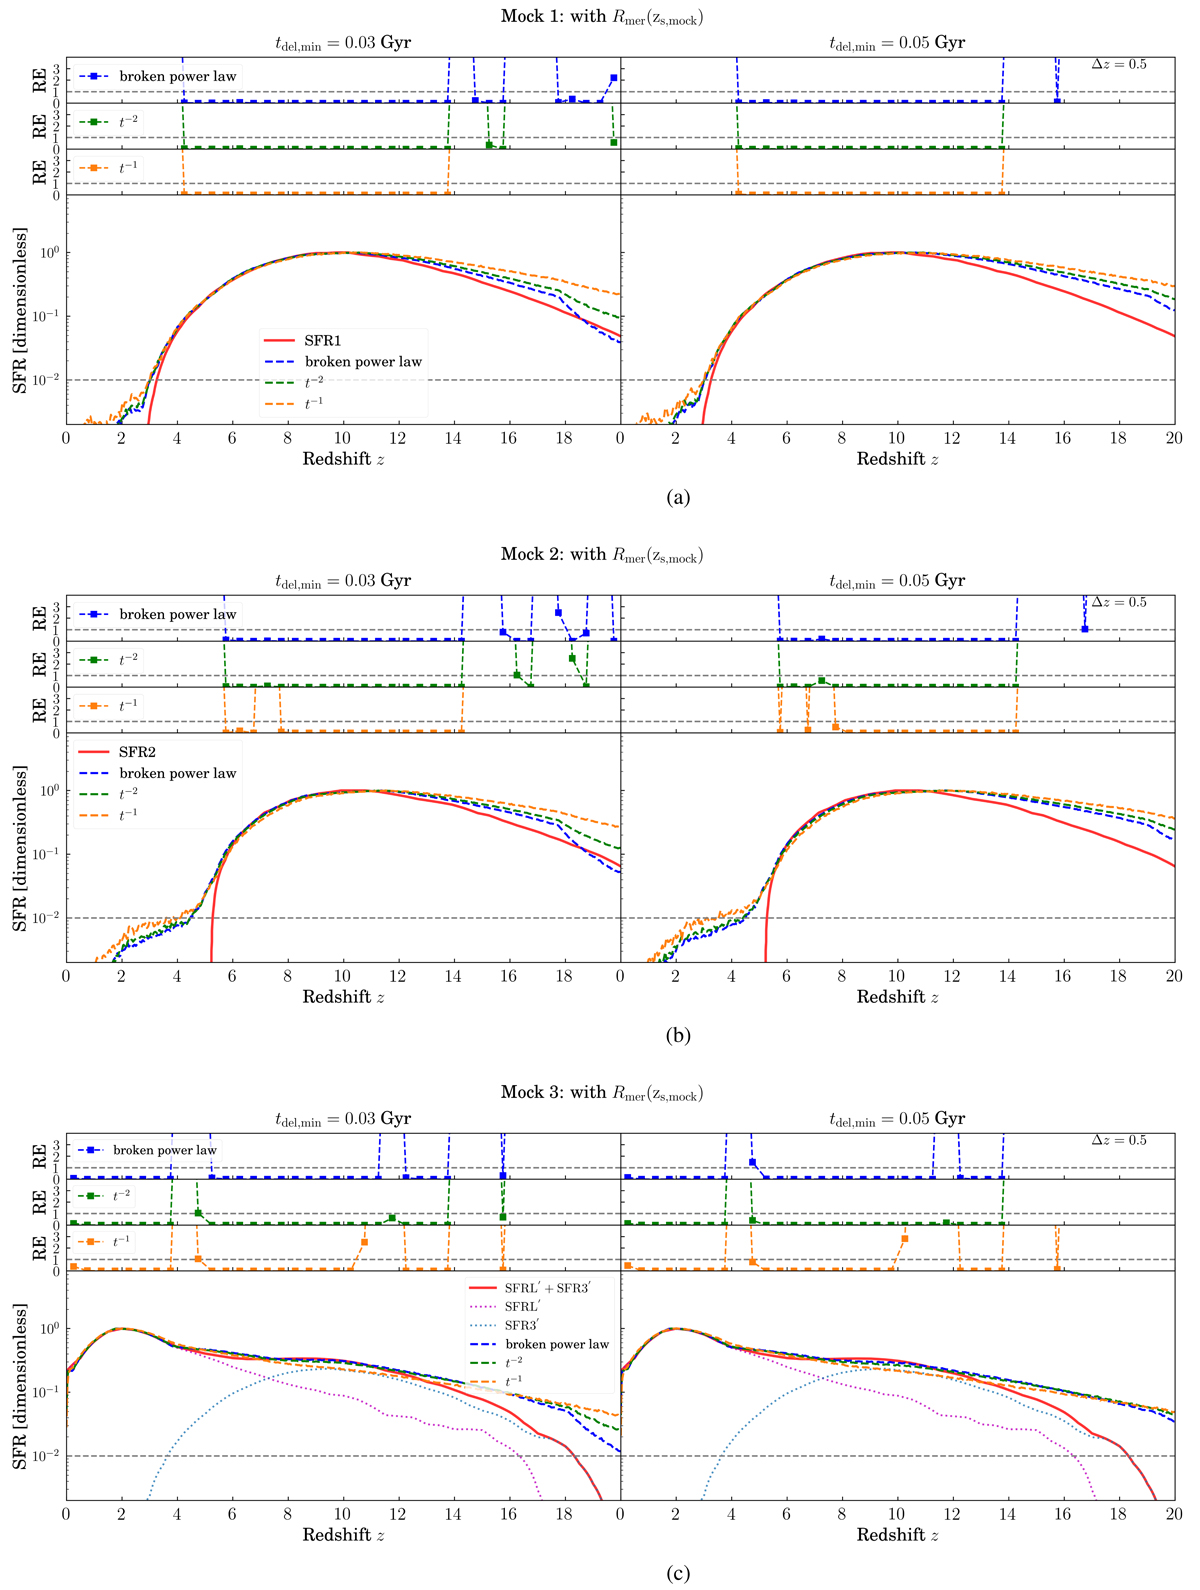
Download original image
Reconstructed SFRs for the three populations, assuming that the merger rate density is highly accurate. The maximum value of the SFR has been normalised to 1. The left and right panels show the reconstruction assuming that tdel, min = 0.03 and 0.05 Gyr, respectively. The top three panels in all three plots show RE or the KL divergence for a redshift bin of Δz = 0.5 in width. The red curve denotes the true SFR. We note that for the Mock 3 population, we estimate the merger-rate-weighted SFR.
Current usage metrics show cumulative count of Article Views (full-text article views including HTML views, PDF and ePub downloads, according to the available data) and Abstracts Views on Vision4Press platform.
Data correspond to usage on the plateform after 2015. The current usage metrics is available 48-96 hours after online publication and is updated daily on week days.
Initial download of the metrics may take a while.