Fig. 3.
Download original image
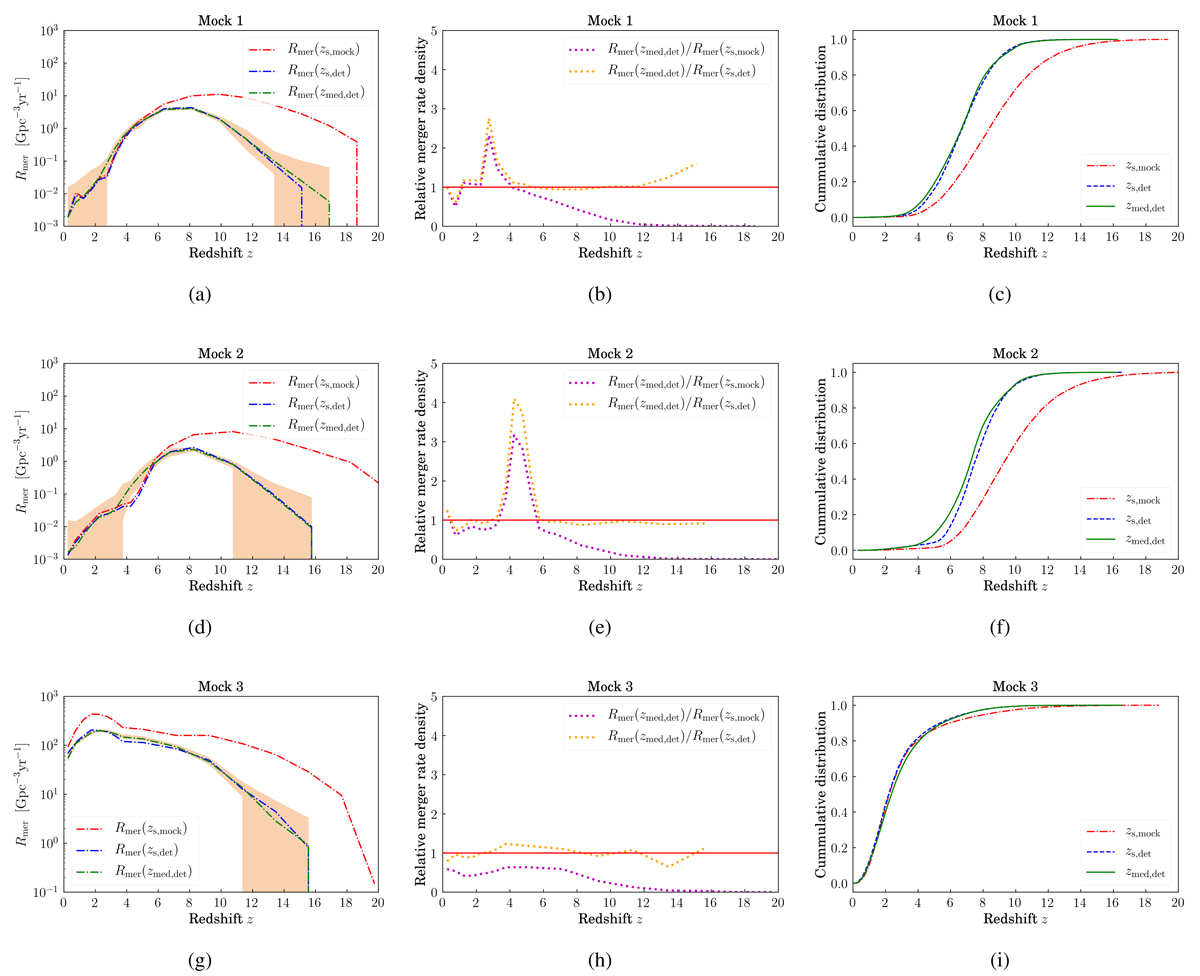
Estimate of the merger rate density. Left: merger rate densities for Mock 1, Mock 2, and Mock 3, respectively. The shaded region represents Poisson error. Middle: Relative merger rate density. Right: cumulative probability distribution of the redshifts for Mock 1, Mock 2, and Mock 3. A description of the acronyms is given in Table D.1.
Current usage metrics show cumulative count of Article Views (full-text article views including HTML views, PDF and ePub downloads, according to the available data) and Abstracts Views on Vision4Press platform.
Data correspond to usage on the plateform after 2015. The current usage metrics is available 48-96 hours after online publication and is updated daily on week days.
Initial download of the metrics may take a while.