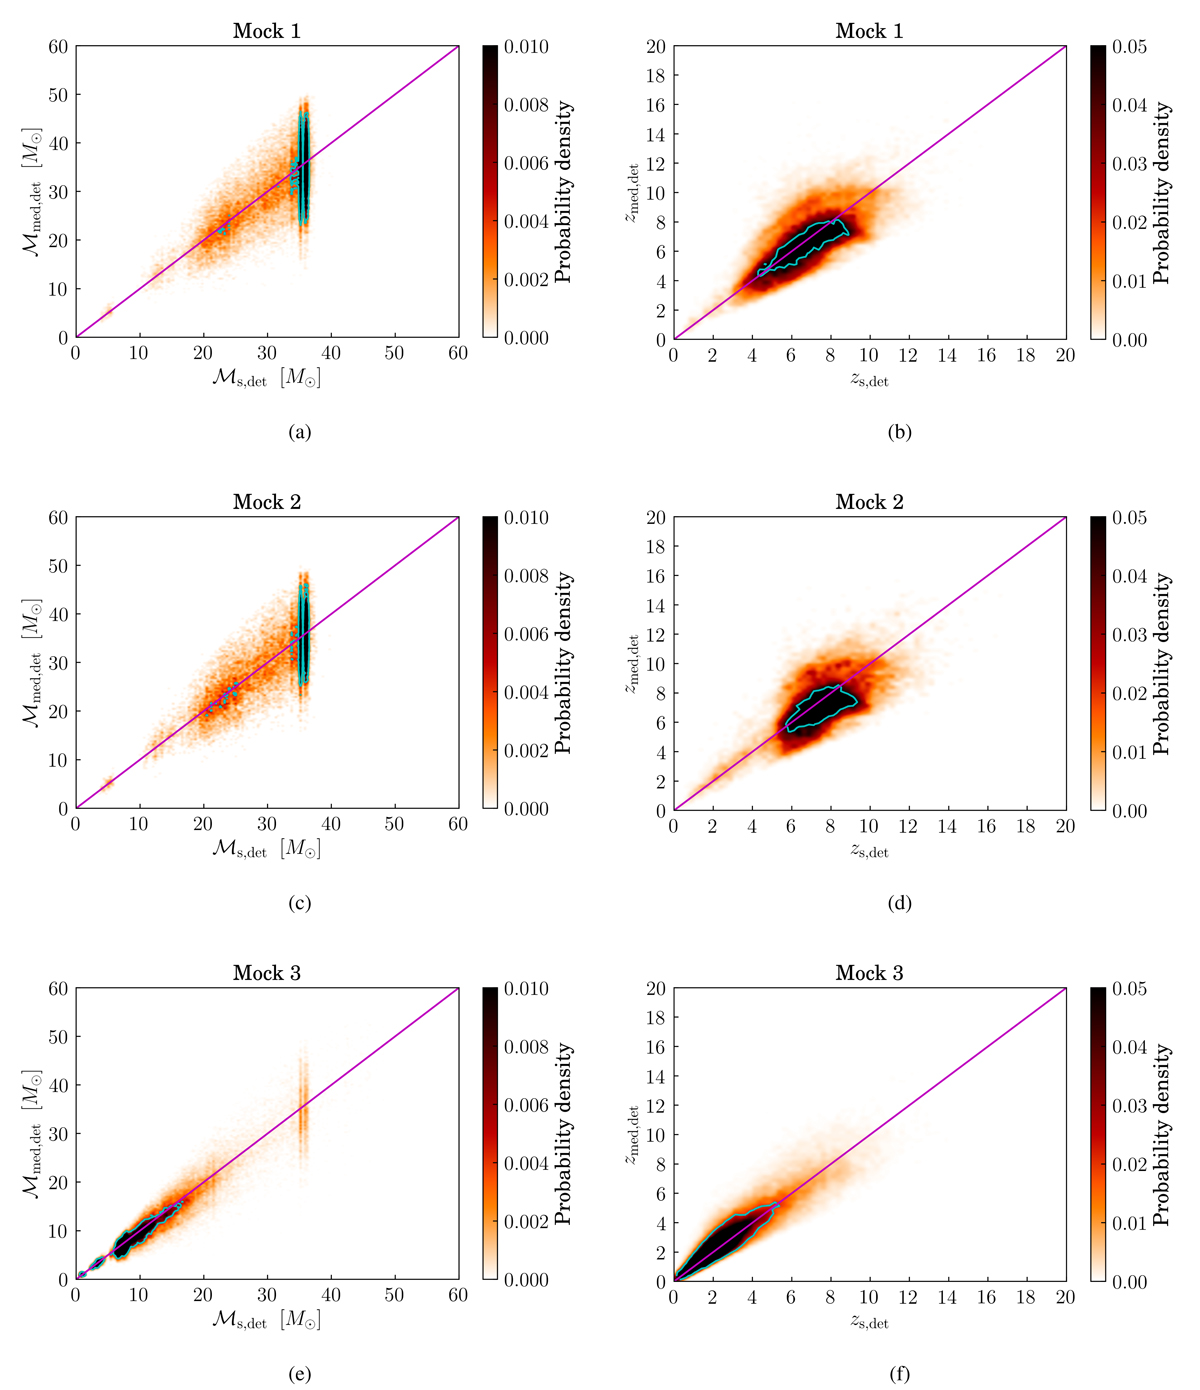
Fig. 2.
Download original image
Estimation of parameters. Density distribution of the median of the estimated posterior with respect to the true values of the parameters: Chirp mass ℳ (left) and redshift z (right) of the detected compact binary sources. Top panel: Mock 1. Middle panel: Mock 2. Bottom panel: Mock 3. The magenta line is a reference for equal values of true and estimated parameters. The blue contour encloses the 90% probability region.
Current usage metrics show cumulative count of Article Views (full-text article views including HTML views, PDF and ePub downloads, according to the available data) and Abstracts Views on Vision4Press platform.
Data correspond to usage on the plateform after 2015. The current usage metrics is available 48-96 hours after online publication and is updated daily on week days.
Initial download of the metrics may take a while.