Fig. 9
Download original image
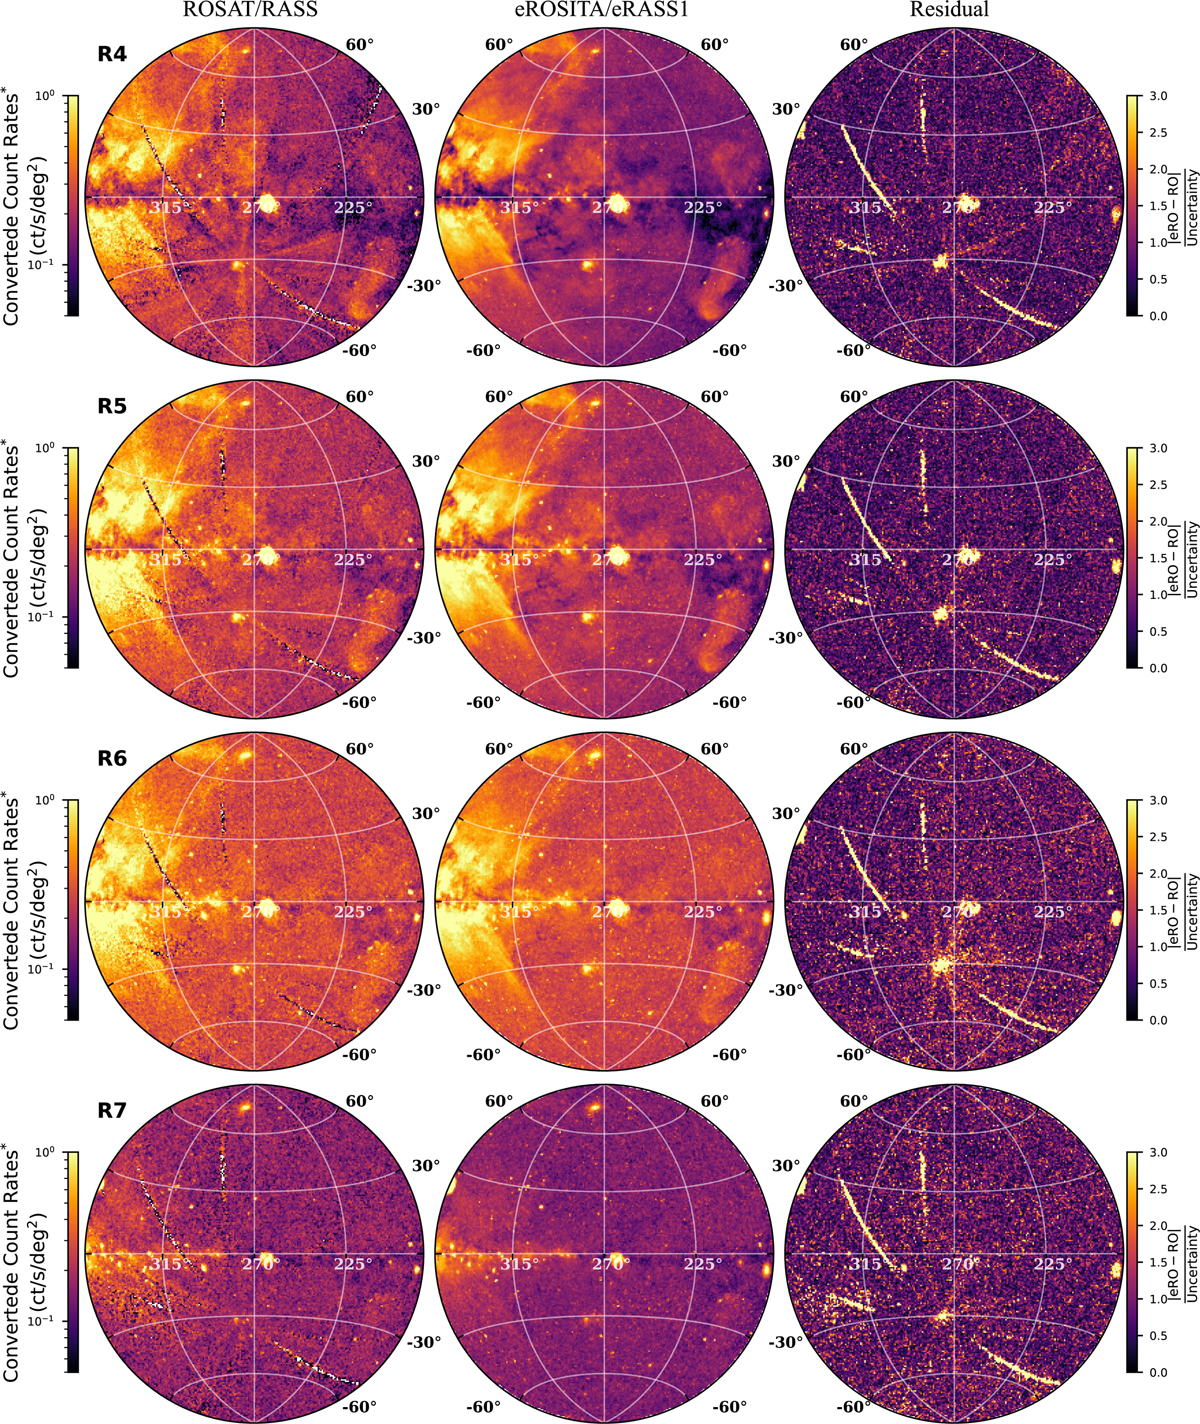
Visual comparison of the data. ROSAT/RASS maps (left column), the converted eROSITA maps (middle column), and the residual maps (right column) of the diffuse emission observed in four bands. The converted count rates are the rates scaled with the ROSAT PSPC response. The deviation is defined as the ![]() . The applied ZEA projection is centered at 1, b = 270.0, 0.0.
. The applied ZEA projection is centered at 1, b = 270.0, 0.0.
Current usage metrics show cumulative count of Article Views (full-text article views including HTML views, PDF and ePub downloads, according to the available data) and Abstracts Views on Vision4Press platform.
Data correspond to usage on the plateform after 2015. The current usage metrics is available 48-96 hours after online publication and is updated daily on week days.
Initial download of the metrics may take a while.