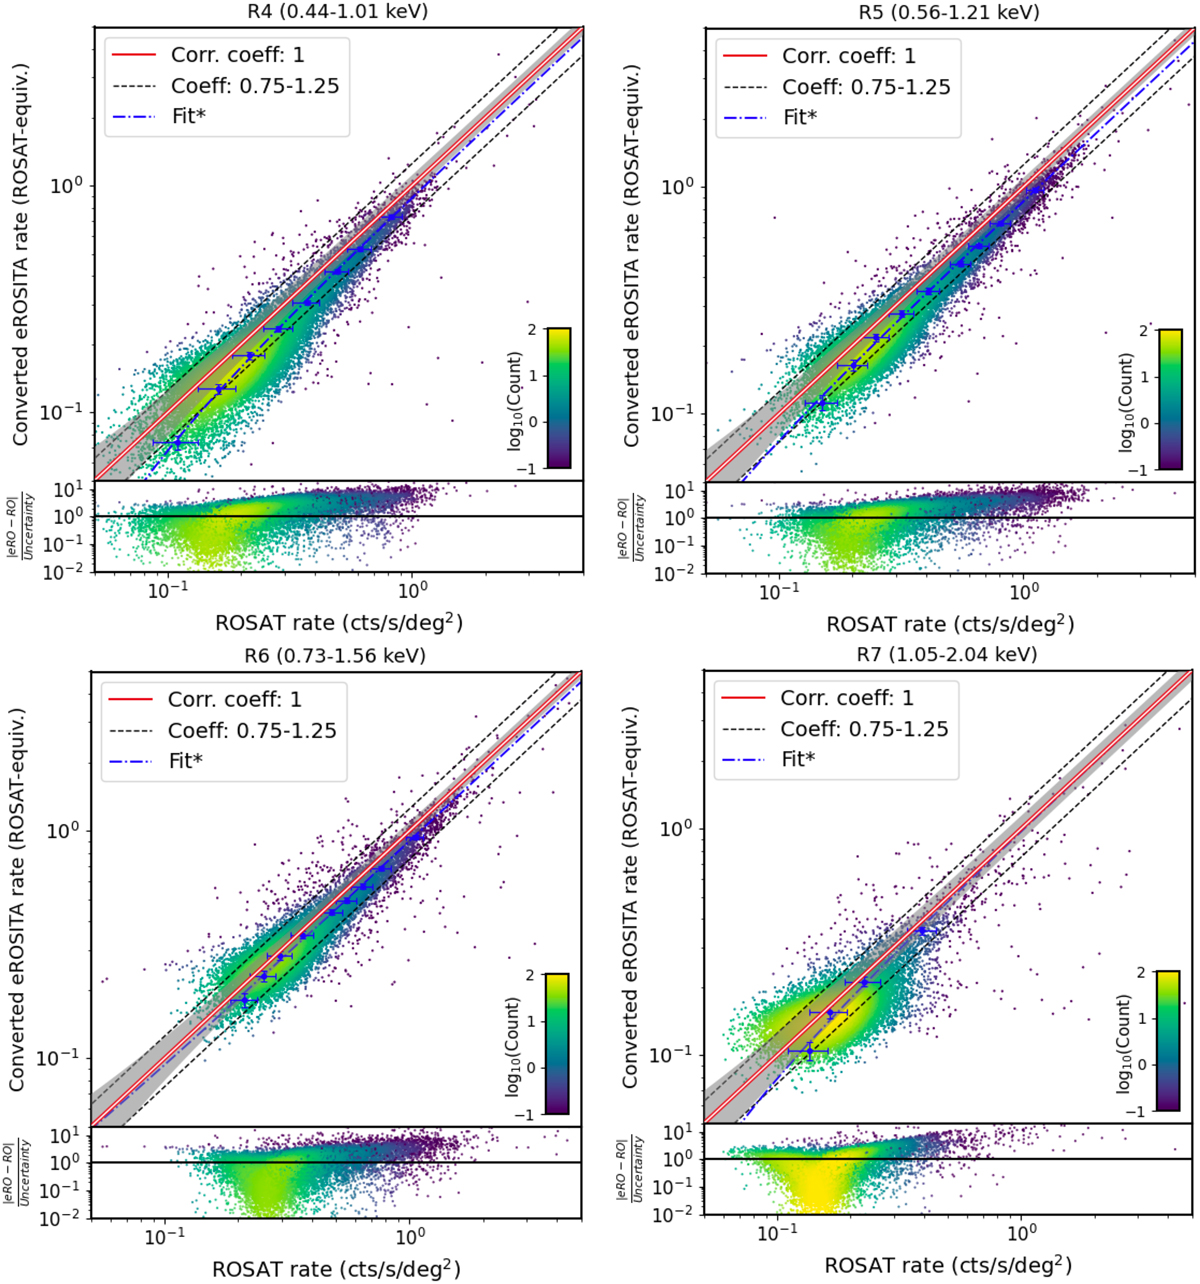
Fig. 8
Download original image
Rate comparison of diffuse emission maps of eROSITA/eRASSl and ROSAT/RASS in log scale. Each data point shows the rates from 0.83 deg2 sky region (NSIDE 64). The converted eROSITA rates were calculated from Eq. (2) to be equivalent to the ROSAT response. The screening is by S/N > 3 in the ROSAT data. The color corresponds the density of the data in this plot. The navy points with error bars mark the density peak in the eROSITA rates with a 1σ confidence. The navy dash-dotted line is the best fit of the densest points. The lines with a slope of 1 and 0.75 (1.25) and zero intercept are shown with the solid red line and dashed black lines, respectively. The intrinsic Poisson uncertainty level corresponding to 1 pix size is shown by the gray shadow.
Current usage metrics show cumulative count of Article Views (full-text article views including HTML views, PDF and ePub downloads, according to the available data) and Abstracts Views on Vision4Press platform.
Data correspond to usage on the plateform after 2015. The current usage metrics is available 48-96 hours after online publication and is updated daily on week days.
Initial download of the metrics may take a while.