Fig. 7
Download original image
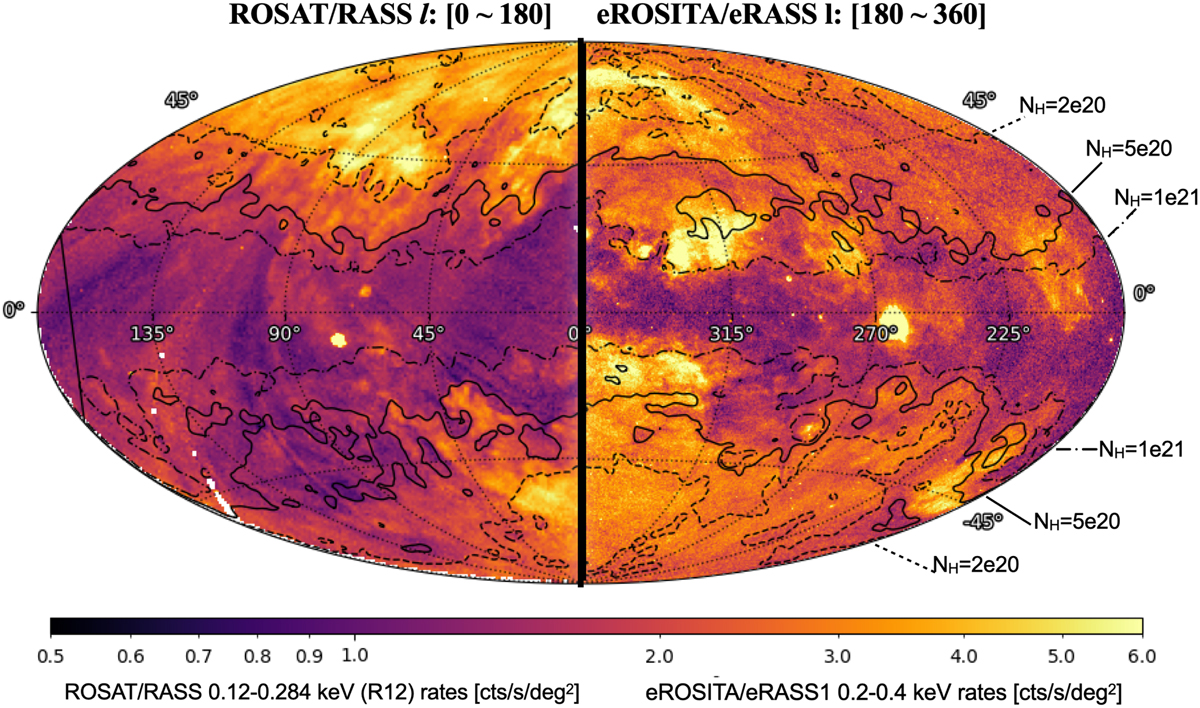
NH1 contours overlaid onto the eROSITA soft-band images. The western sky l = [180, 360] shows the eROSITA/eRASSl data in the 0.2–0.4 keV band mirrored with respect to Galactic longitude l = 0. The eastern sky l = [0, 180] shows the ROSAT/RASS R12 (0.11-0.284 keV) band map. The contour superimposed are the column density from the HI4PI survey: NH1 = 2 × 10²⁰ (dotted), 5 × 10²⁰ (solid), and 1 × 1021 cm−2 (dot dashed).
Current usage metrics show cumulative count of Article Views (full-text article views including HTML views, PDF and ePub downloads, according to the available data) and Abstracts Views on Vision4Press platform.
Data correspond to usage on the plateform after 2015. The current usage metrics is available 48-96 hours after online publication and is updated daily on week days.
Initial download of the metrics may take a while.