Fig. 4
Download original image
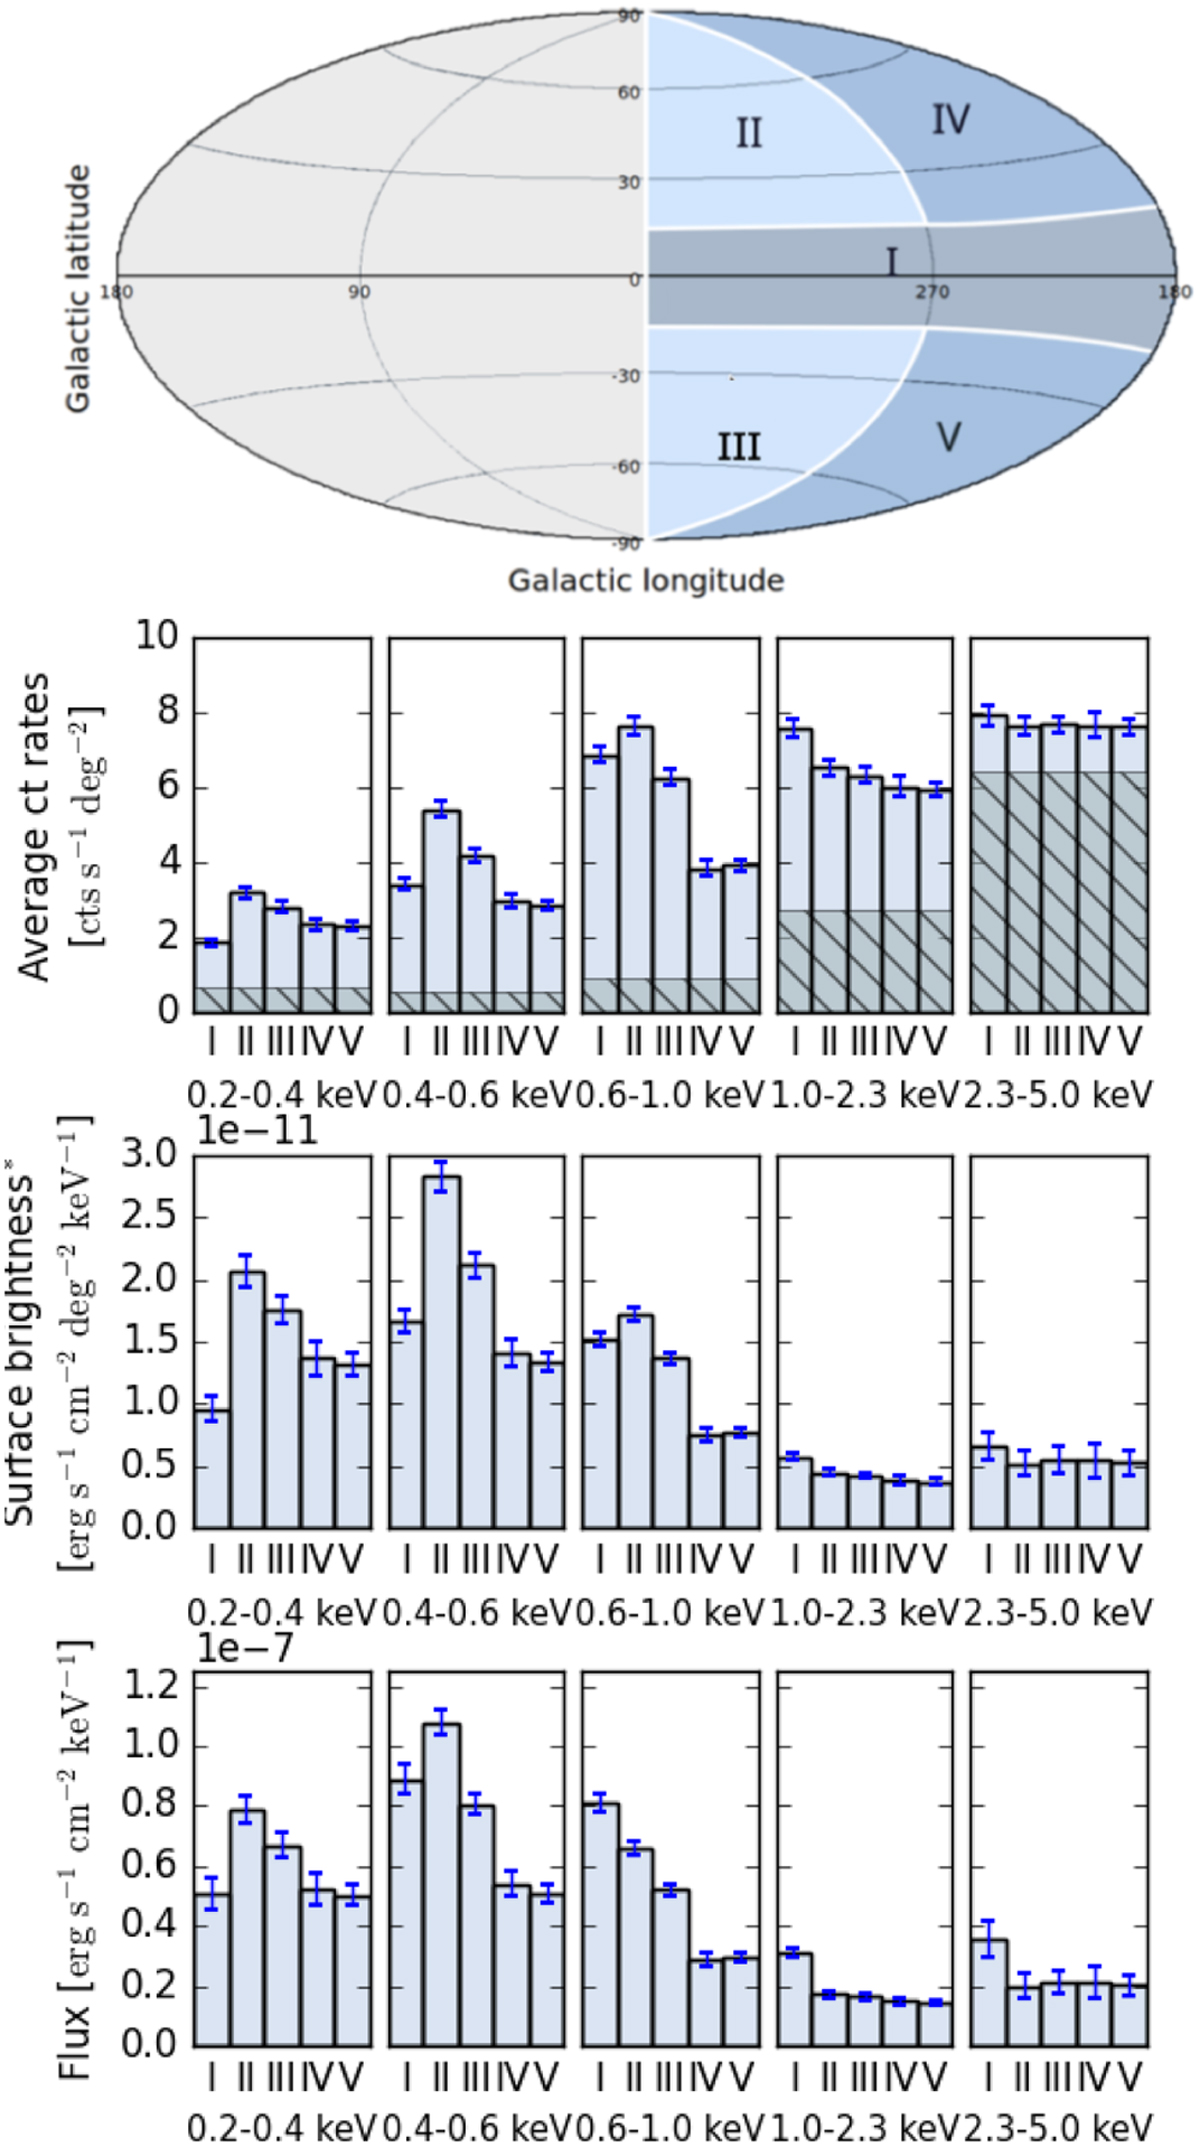
Configuration and observed properties of the sky patches. We divided the eROSITA DE sky into five parts as listed in Table 3. The hatched gray regions in the count-rate histogram show the level of the particle background. We converted count rates into surface brightness assuming a power-law model S ∝ E−Γ with Γ = 2 and absorption as in Table 3. The surface brightness and flux estimations use the ECFs reported in Table 2.
Current usage metrics show cumulative count of Article Views (full-text article views including HTML views, PDF and ePub downloads, according to the available data) and Abstracts Views on Vision4Press platform.
Data correspond to usage on the plateform after 2015. The current usage metrics is available 48-96 hours after online publication and is updated daily on week days.
Initial download of the metrics may take a while.