Open Access
Fig. E.3
Download original image
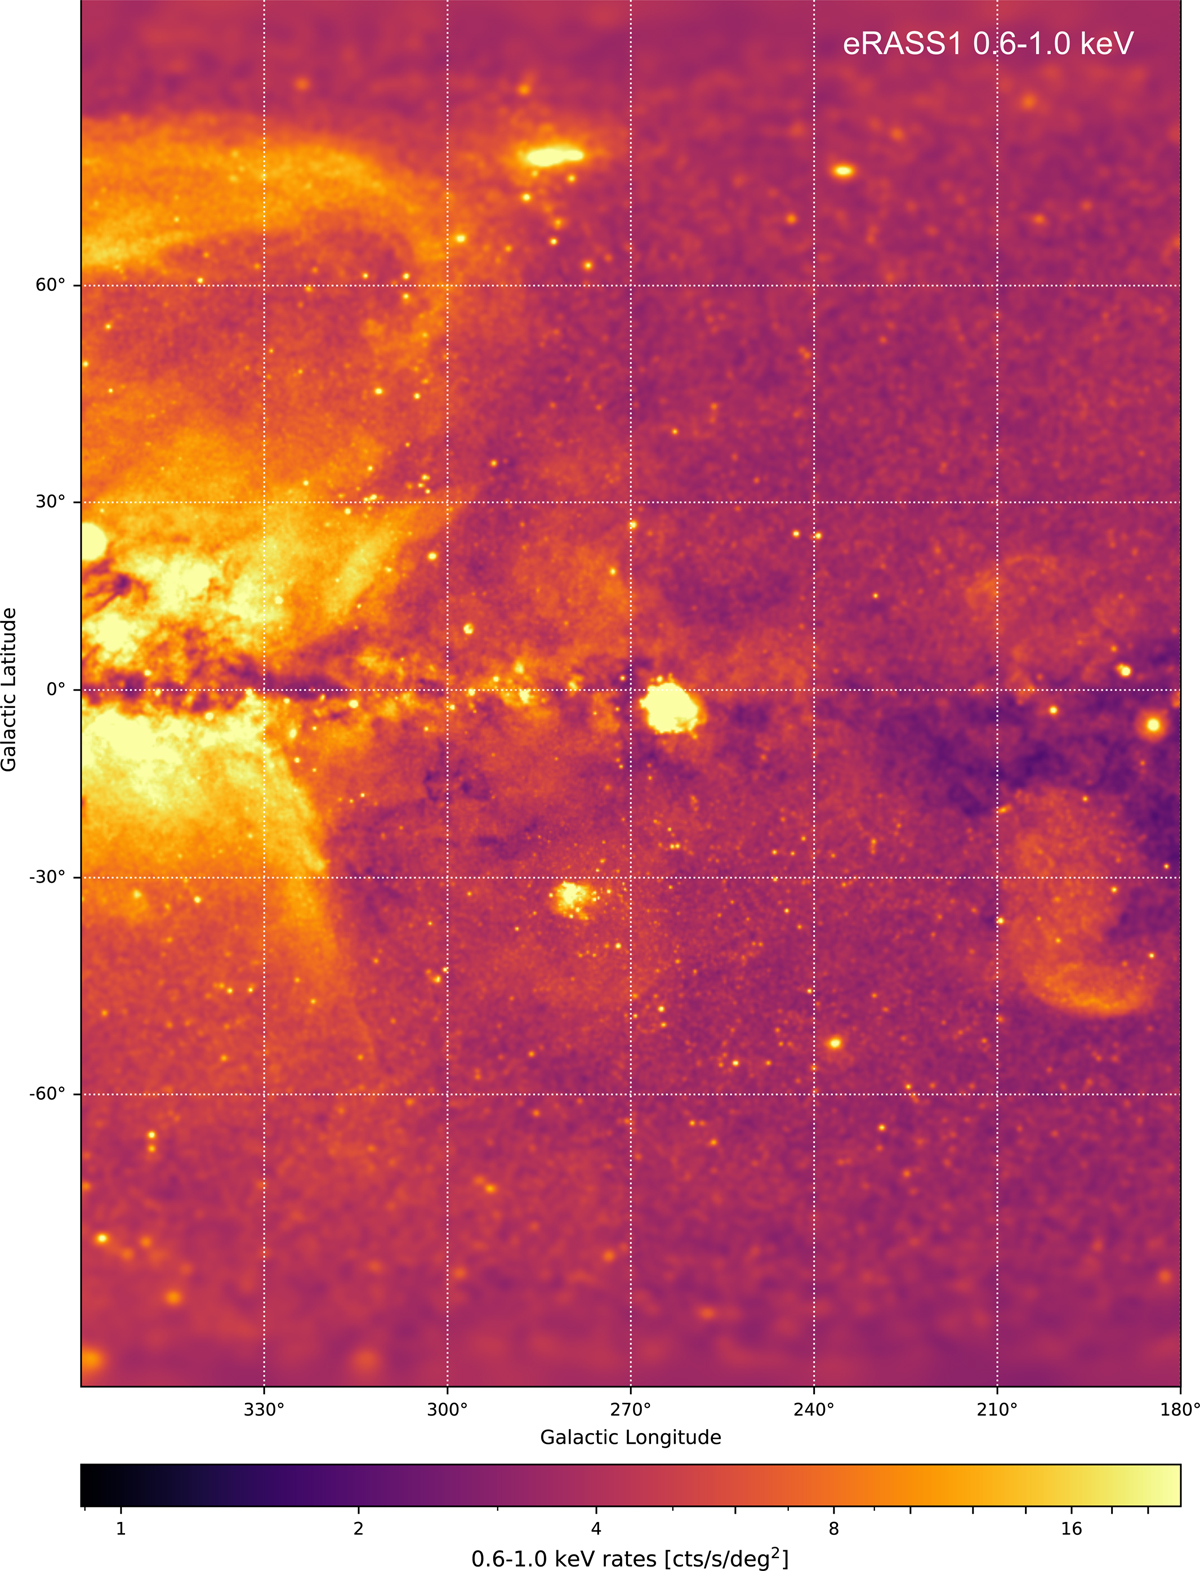
Broadband 0.6–1.0 keV eRASS1 map in CYP. The color bar shows the range 1.0 – 22.0 cts s−1 deg−2 in log scale. An adaptive smoothing with S/N ≥ 20 is used. The minimum threshold is set at the instrumental background of this energy band.
Current usage metrics show cumulative count of Article Views (full-text article views including HTML views, PDF and ePub downloads, according to the available data) and Abstracts Views on Vision4Press platform.
Data correspond to usage on the plateform after 2015. The current usage metrics is available 48-96 hours after online publication and is updated daily on week days.
Initial download of the metrics may take a while.