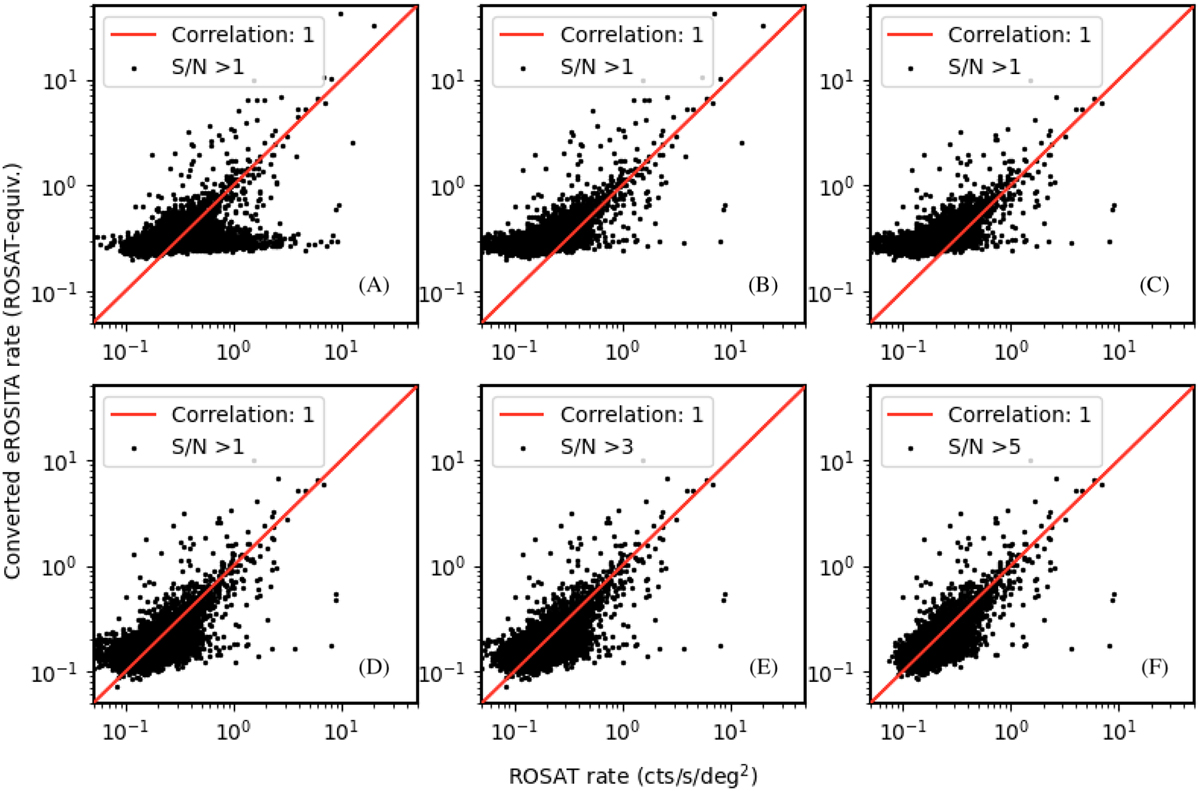
Fig. A.1
Download original image
Detailed view of the ROSAT and eROSITA comparison in the R7 energy band. (A)–(B): Horizontal branch deviation (shown in A) without the negative values. Instead, keeping and smoothing them results in the improved plot (B). This corresponds to the correction “ROSAT elliptic longitudinal stripes” in the text. (B)–(C): We masked out the Sco X-1 in plot (C) because the single-reflection effect is stronger in eROSITA. By this, we removed about 30 data points, which exceed than 1 - 1 relation as for the result. This corresponds to the correction in “Light reflection”. (C)–(D): Particle background of eROSITA was subtracted in this step to match the ROSAT data, which are free of particle background. (D)–(E)–(F): Selection over ROSAT S/N. Increasing the S/N threshold sharpens the 1 - 1 relation especially in fainter samples. This step corresponds to the “uncertainty selection.”
Current usage metrics show cumulative count of Article Views (full-text article views including HTML views, PDF and ePub downloads, according to the available data) and Abstracts Views on Vision4Press platform.
Data correspond to usage on the plateform after 2015. The current usage metrics is available 48-96 hours after online publication and is updated daily on week days.
Initial download of the metrics may take a while.