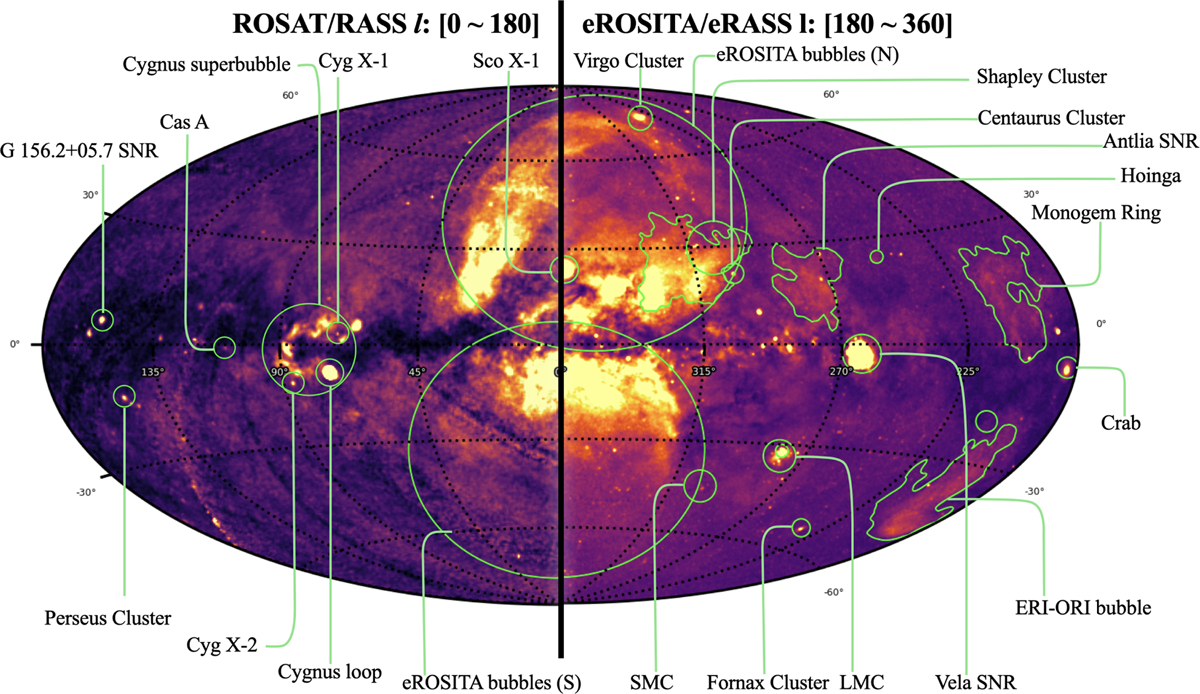
Fig. 12
Download original image
Finding chart of the all-sky diffuse emission. The western sky l = [180, 360] is shown with the eROSITA/eRASSl data in the 0.4–0.6 keV band. The eastern sky l = [0, 180] is shown with the ROSAT/RASS R4 (0.44–1.01 keV) band map. The green marks show the location of large projected structures, including known supernova remnants, the Large and Small Magellanic Clouds, and some extended clusters and galaxy superclusters. The color bar has been arbitrarily chosen to match the dynamic ranges of the maps.
Current usage metrics show cumulative count of Article Views (full-text article views including HTML views, PDF and ePub downloads, according to the available data) and Abstracts Views on Vision4Press platform.
Data correspond to usage on the plateform after 2015. The current usage metrics is available 48-96 hours after online publication and is updated daily on week days.
Initial download of the metrics may take a while.