Fig. 11
Download original image
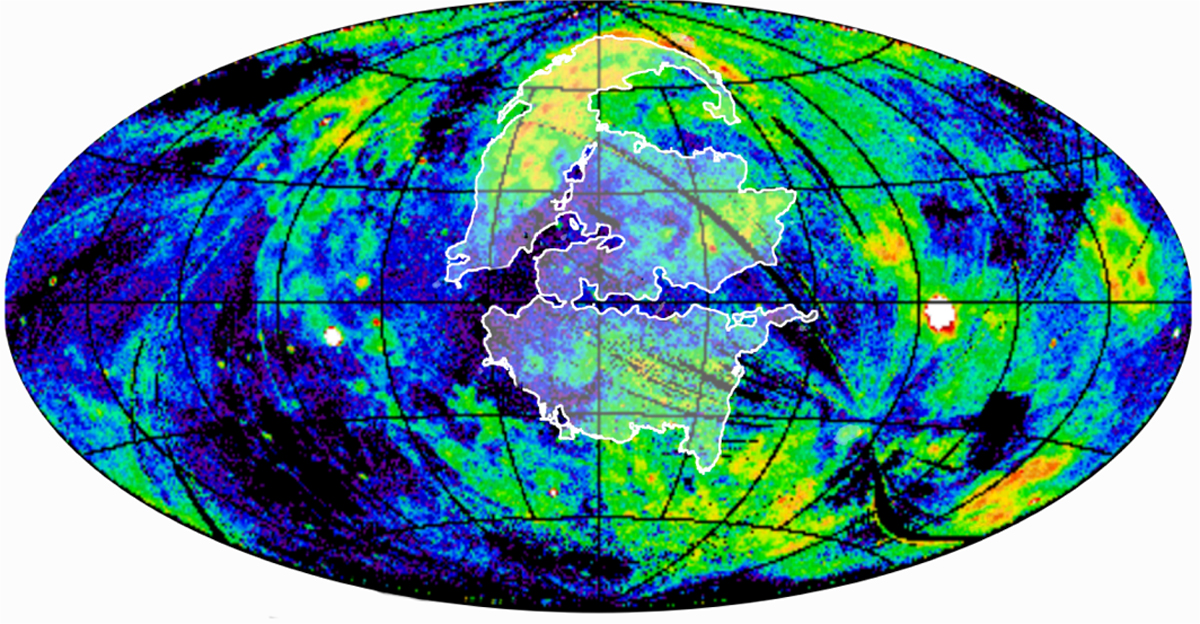
Foreground components in the ROSAT map with the eROSITA bubble contour overlaid. This foreground maps was built by Freyberg (1994), who modeled and separated the foreground emissions from RASS map. The resulting maps are shown with the angular resolution of 0.2°. We overlay the contour of eROSITA bubbles (defined from 0.6–1.0 keV band) as a white translucent area.
Current usage metrics show cumulative count of Article Views (full-text article views including HTML views, PDF and ePub downloads, according to the available data) and Abstracts Views on Vision4Press platform.
Data correspond to usage on the plateform after 2015. The current usage metrics is available 48-96 hours after online publication and is updated daily on week days.
Initial download of the metrics may take a while.