Fig. 10
Download original image
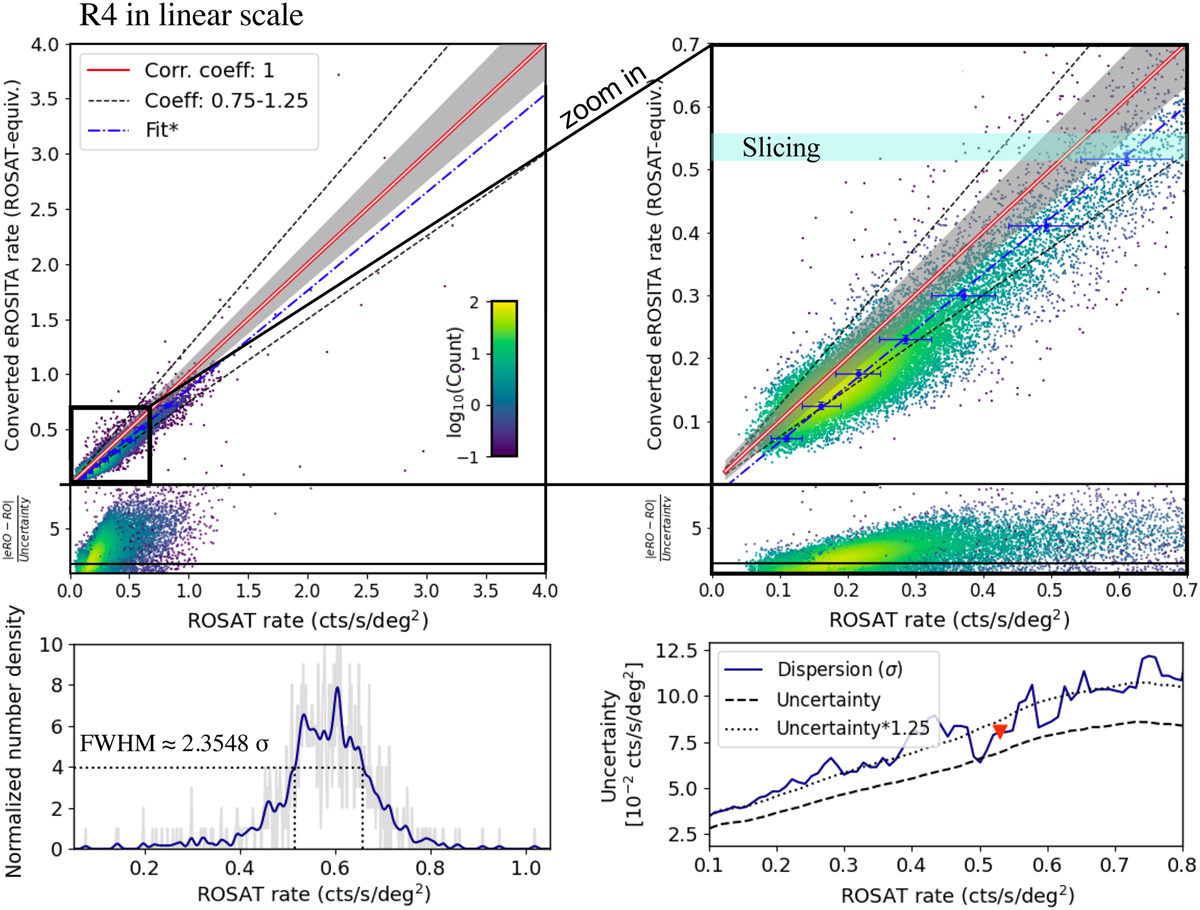
Detailed view of the ROSAT and eROSITA comparison in the R4 energy band. Top left: same as Fig. 8 (top left panel), shown in linear scale. Top right: zoom-in on the rate range 0−0.8cts s−1 deg−2. Bottom left: schematic distribution of the ROSAT rates taken from the redefined eROSITA rate range (shown in cyan in the top right panel). The blue line is the smoothed number density that falls into this rate channel, from which the FWHM is measured. Bottom right: equivalent a and the uncertainty reported by ROSAT with respect to the eROSITAconverted rates. The ROSAT uncertainty is dominated by Poissonian noise. The red triangle shows the equivalent σ from the bottom left panel. The 1.25 times ROSAT uncertainty is shown with a dashed line for comparison.
Current usage metrics show cumulative count of Article Views (full-text article views including HTML views, PDF and ePub downloads, according to the available data) and Abstracts Views on Vision4Press platform.
Data correspond to usage on the plateform after 2015. The current usage metrics is available 48-96 hours after online publication and is updated daily on week days.
Initial download of the metrics may take a while.