Fig. 8
Download original image
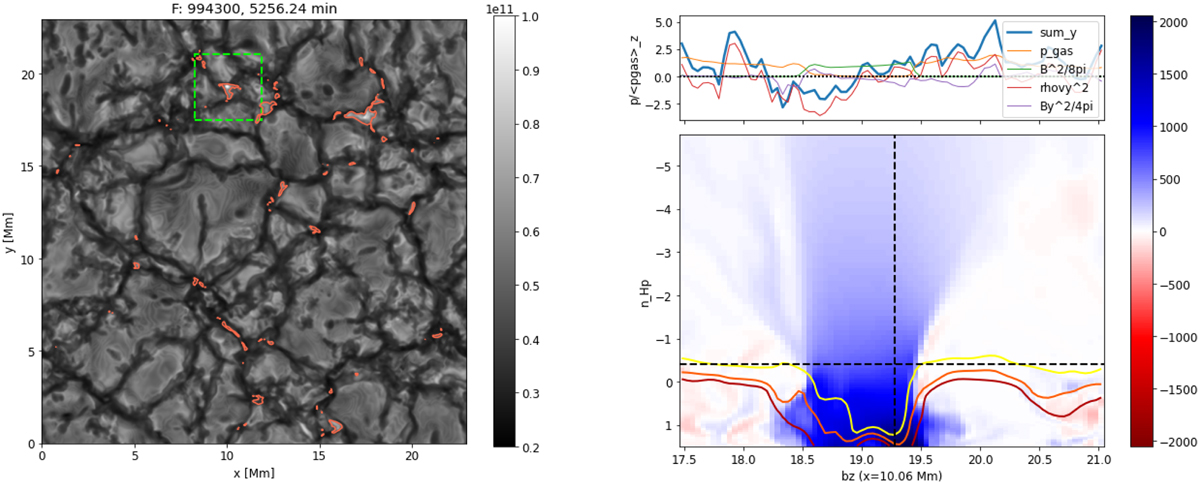
Horizontal force balance in a vertical slice of a magnetic field concentration for the F star. Left: plot of the bolometric intensity. The selected magnetic element is highlighted by the green rectangle. The red contours represent areas with B2/8π > pgas. Right: map of Bɀ in the x-plane with the horizontal axis in Mm and the vertical axis in the number of pressure scale heights above (negative) and below (positive) the 〈τ〉 = 1 height. The dark red, red, and yellow contours show the iso log10 τ =1,0,−1 surfaces, respectively. The line plot on top shows the diagonal terms of the total stress tensor (see Eq. (1) and Sect. 4.1 for details). An animation is available online.
Current usage metrics show cumulative count of Article Views (full-text article views including HTML views, PDF and ePub downloads, according to the available data) and Abstracts Views on Vision4Press platform.
Data correspond to usage on the plateform after 2015. The current usage metrics is available 48-96 hours after online publication and is updated daily on week days.
Initial download of the metrics may take a while.