Fig. 7
Download original image
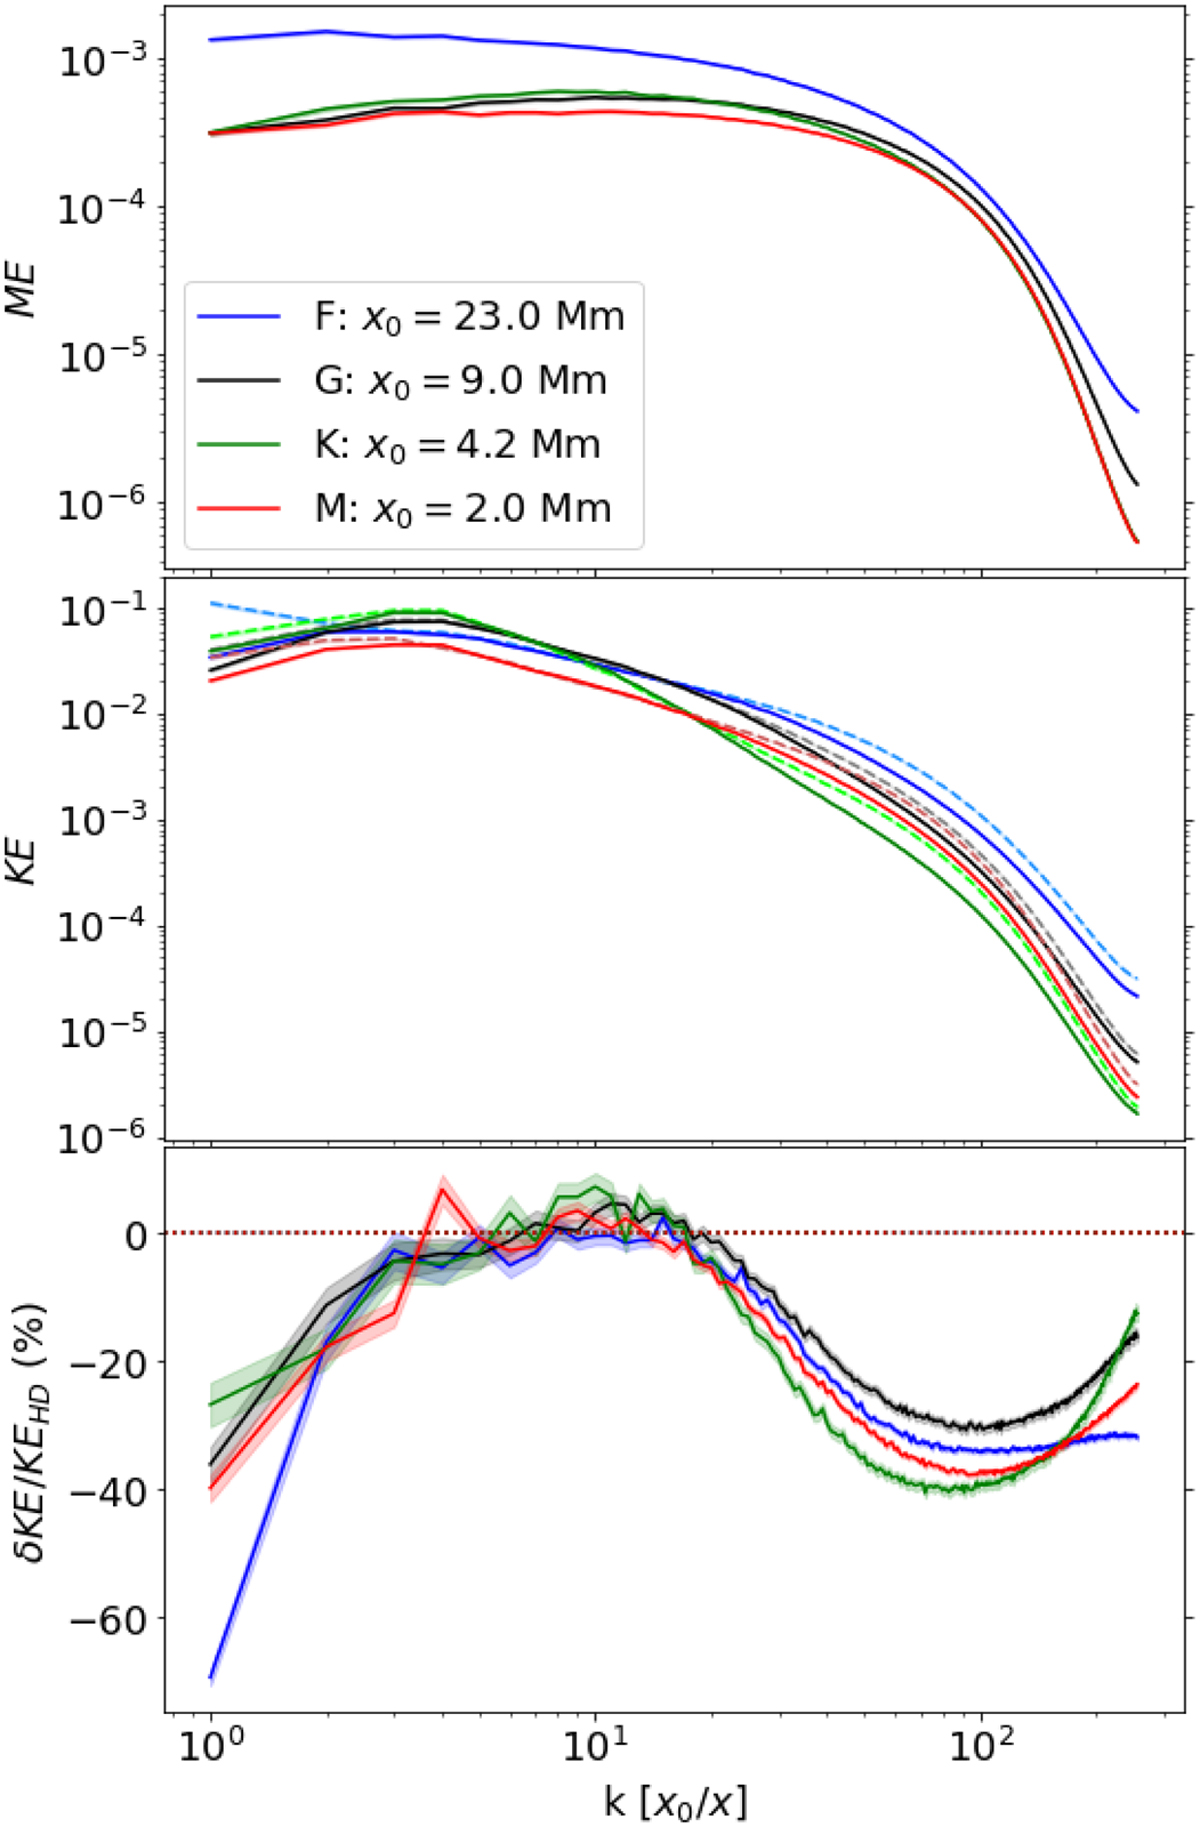
Spatial power spectrum of magnetic and kinetic energies at the iso τ = 1 surface. Top: power spectrum of the magnetic energy for all the SSD cases. Middle: power spectrum of the kinetic energy for all the SSD (solid, dark) and HD (dashed, light) cases. Bottom: percent change in the kinetic energy power spectrum for SSD cases relative to HD cases. The top and middle plots are normalized by the total kinetic energy for the F star (solid blue).
Current usage metrics show cumulative count of Article Views (full-text article views including HTML views, PDF and ePub downloads, according to the available data) and Abstracts Views on Vision4Press platform.
Data correspond to usage on the plateform after 2015. The current usage metrics is available 48-96 hours after online publication and is updated daily on week days.
Initial download of the metrics may take a while.