Fig. 4
Download original image
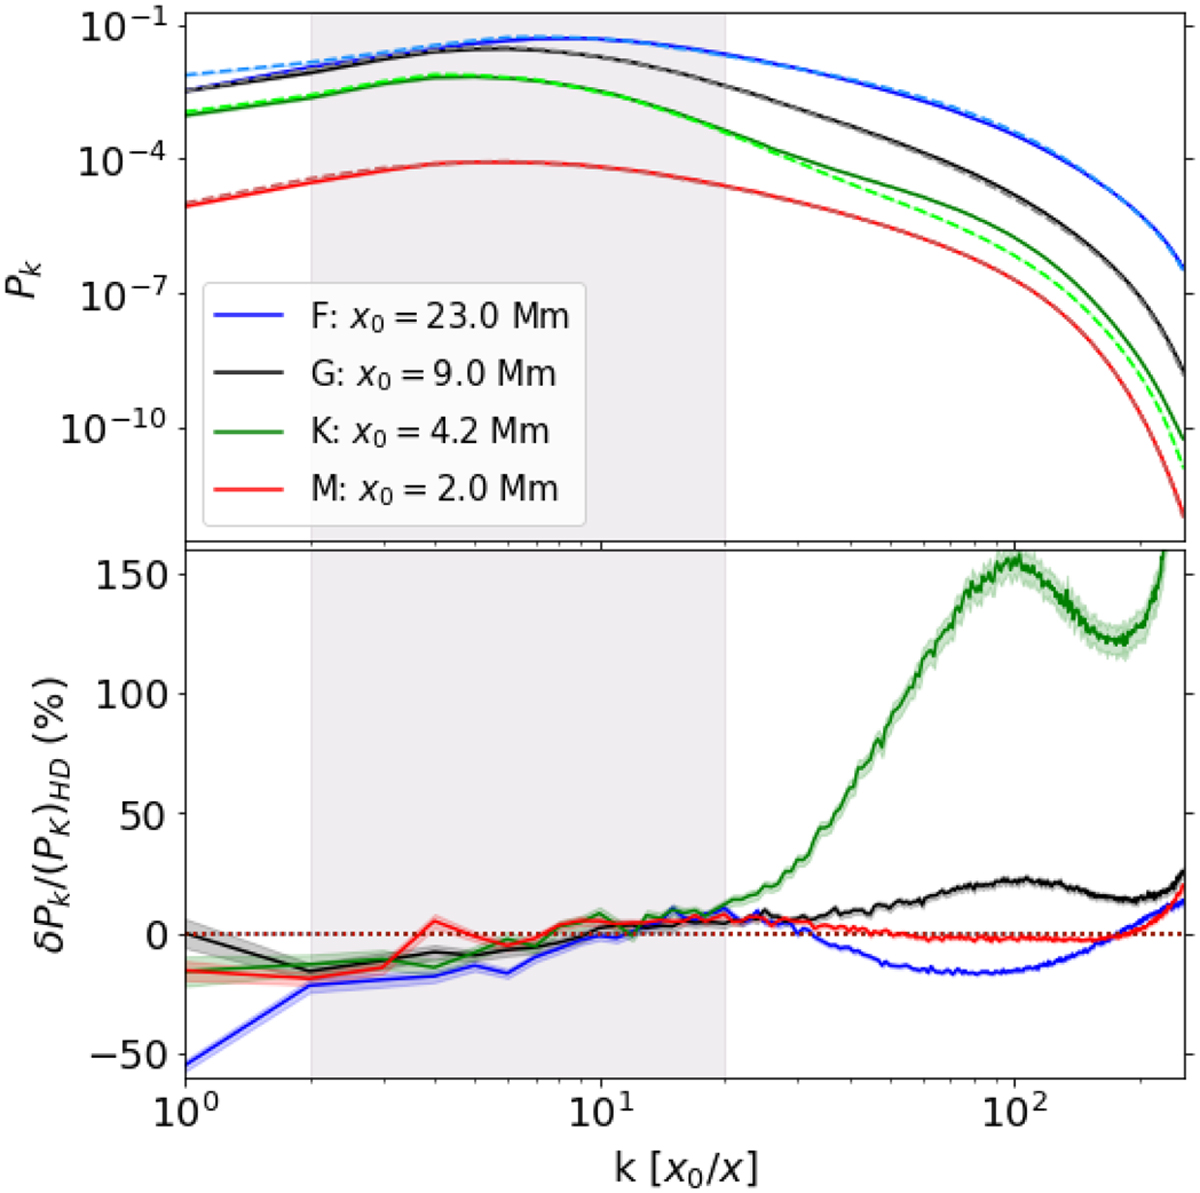
Spatial power spectra Pk of bolometric intensity Ibol for the SSD (solid) and HD (dashed) cases plotted against spatial frequency 1/x (normalized by the horizontal box size x0 for each star). Top: Pk for all cases normalized by the SSD F star total power (Σk Pk). Bottom: Relative change in power at different scales between the SSD and HD cases. The gray shaded region refers to the approximate scales corresponding to the range in granule sizes, for which the center of gravity is calculated in Table 2.
Current usage metrics show cumulative count of Article Views (full-text article views including HTML views, PDF and ePub downloads, according to the available data) and Abstracts Views on Vision4Press platform.
Data correspond to usage on the plateform after 2015. The current usage metrics is available 48-96 hours after online publication and is updated daily on week days.
Initial download of the metrics may take a while.