Fig. 7
Download original image
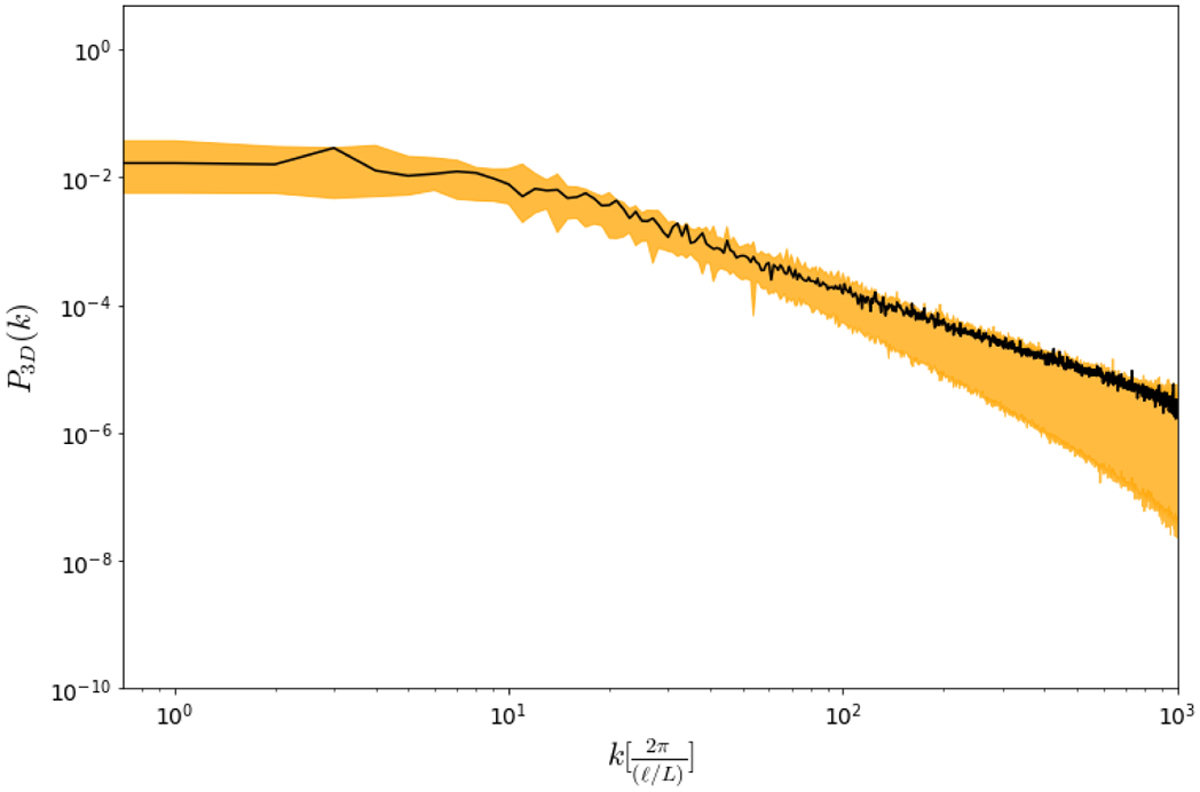
As with Fig. 2, but for the case displayed in Fig. 6. In this case, all modes are relevant and well constrained, as opposed to the case of Fig. 2. Furthermore, we note that as k becomes larger the posterior of the power spectrum starts deviating from that of the signal, implying a loss of information at smaller lengthscales, as observed in Fig. 6.
Current usage metrics show cumulative count of Article Views (full-text article views including HTML views, PDF and ePub downloads, according to the available data) and Abstracts Views on Vision4Press platform.
Data correspond to usage on the plateform after 2015. The current usage metrics is available 48-96 hours after online publication and is updated daily on week days.
Initial download of the metrics may take a while.