Fig. 6
Download original image
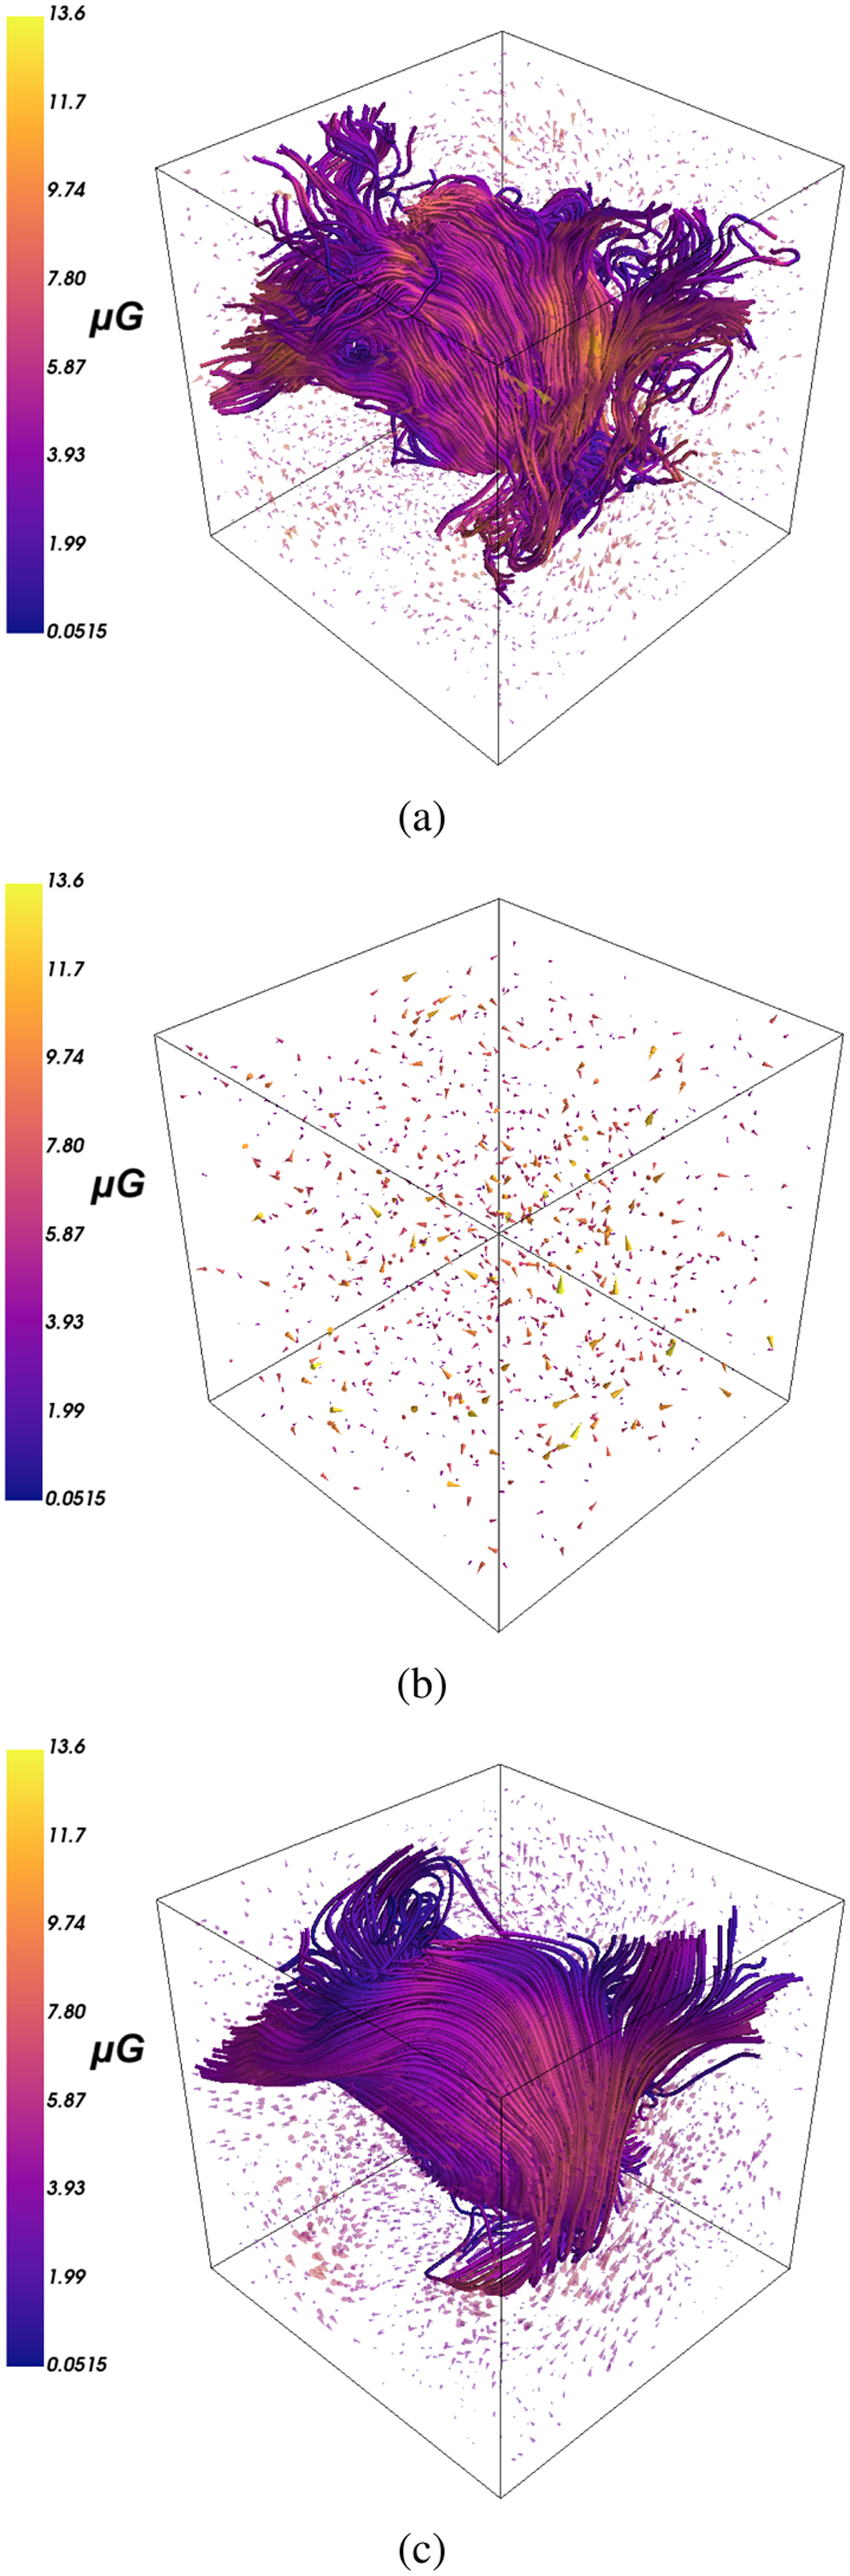
Reconstruction of an isotropically turbulent 3D magnetic field within a cube of side L = 3 kpc. Top: the ground truth; an isotropically turbulent GMF with an RMS magnitude of 5 µG. The colormap denotes the vector’s magnitude. Middle: local data sampled uniformly. The mean distance between each data point is 300 pc. The colormap is saturated at the maximum magnitude that appears in Fig. 6a. Bottom: the mean of the approximating Gaussian posterior distribution attained via the geoVI algorithmn based on the data provided in Fig. 6b.
Current usage metrics show cumulative count of Article Views (full-text article views including HTML views, PDF and ePub downloads, according to the available data) and Abstracts Views on Vision4Press platform.
Data correspond to usage on the plateform after 2015. The current usage metrics is available 48-96 hours after online publication and is updated daily on week days.
Initial download of the metrics may take a while.