Fig. 2
Download original image
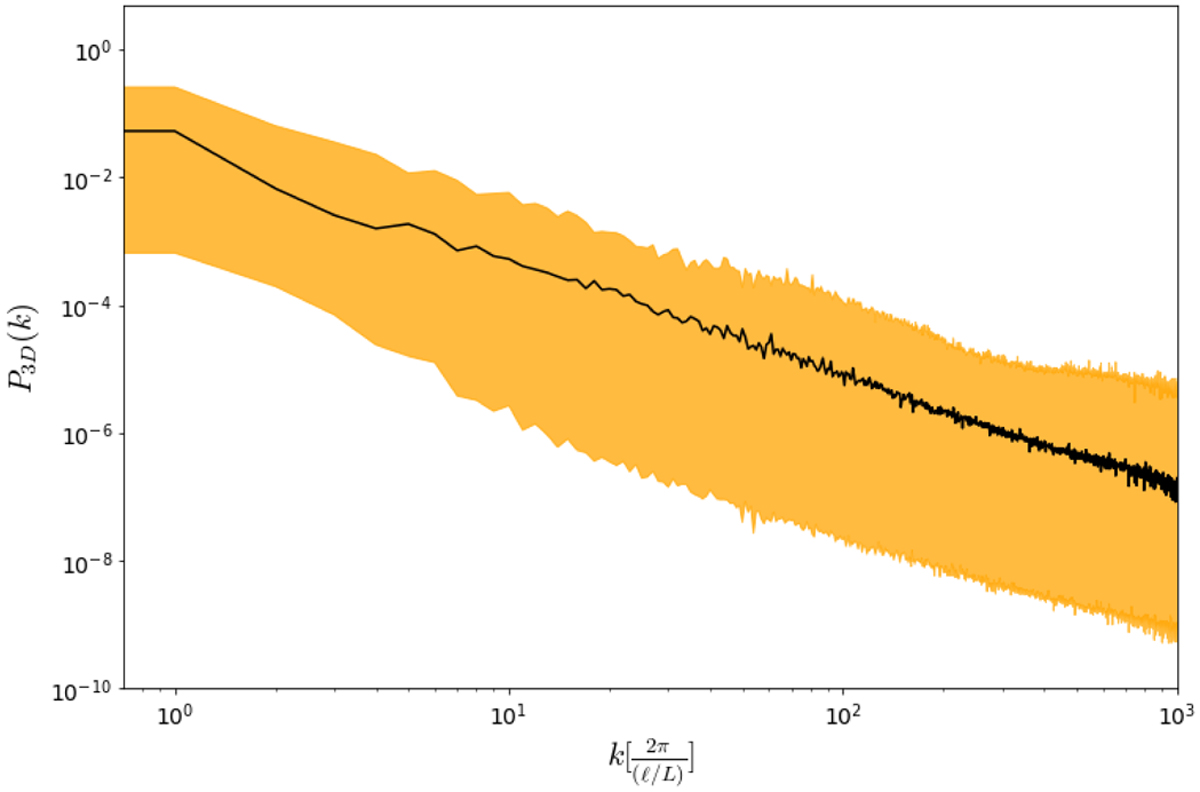
The three-dimensional power spectrum, P3D(k), corresponding to the example showcased in Fig. 1. The black line is the power spectrum of the mock signal, while the orange envelope encompasses the posterior samples, providing the variance for the posterior mean power spectrum estimate. The wavevector, k, is given in units of 2π/N. The large scatter is due to the fact that we have few and noisy data points, in a signal that is dominated by its uniform component, and thus the modes with k > 0 are poorly constrained.
Current usage metrics show cumulative count of Article Views (full-text article views including HTML views, PDF and ePub downloads, according to the available data) and Abstracts Views on Vision4Press platform.
Data correspond to usage on the plateform after 2015. The current usage metrics is available 48-96 hours after online publication and is updated daily on week days.
Initial download of the metrics may take a while.