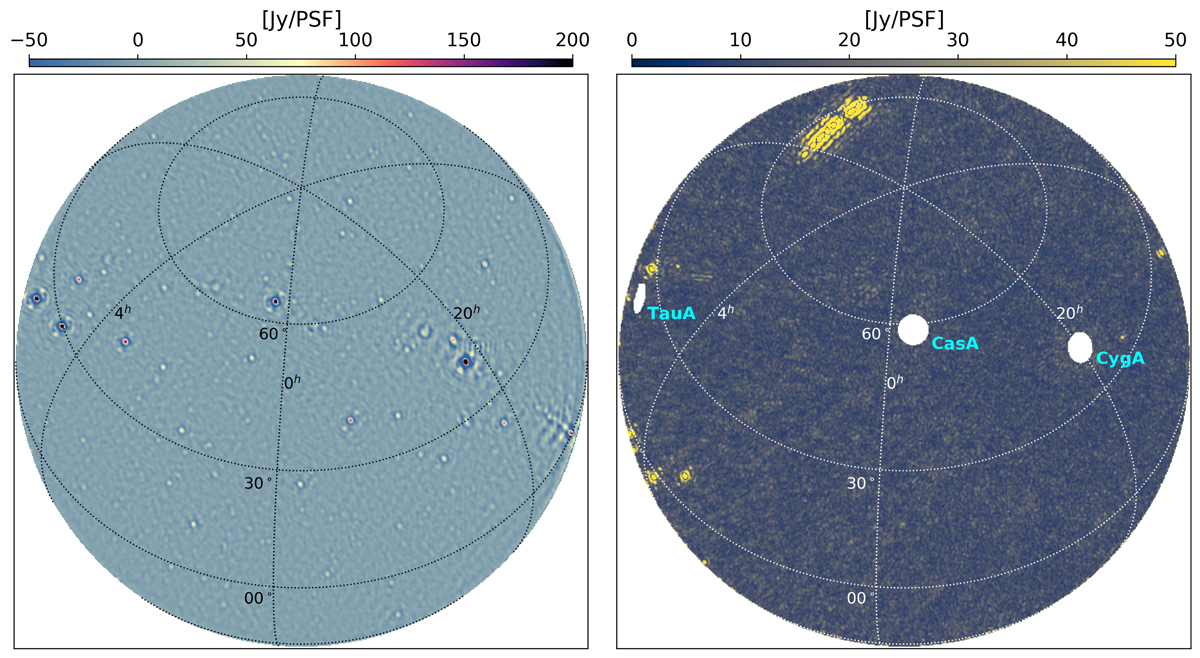
Fig. 1.

Download original image
Images produced with a subset of ACE data. The left panel shows a dirty continuum image of the sky produced with a one-minute subset of data from one of the nights used in the analysis. The colour scale of the image has been saturated to highlight a wide range of fluxes. The right panel shows a spatial map highlighting the transient RFI over the one-minute duration, extracted from the same subset of data used to produce the continuum image in the left panel. Blank pixels in the panel correspond to the bright A-team sources, Cas A, Cyg A, and Tau A. Additionally, the 5° region above the horizon has been excluded from both images. The bright pixels are narrow-band emissions deviating from the continuum emission shown in the left panel and are likely to be from the transient RFI. The stretched structure in the top part of the spatial map is likely an aeroplane and moves slowly over the sky (several minutes across the field).
Current usage metrics show cumulative count of Article Views (full-text article views including HTML views, PDF and ePub downloads, according to the available data) and Abstracts Views on Vision4Press platform.
Data correspond to usage on the plateform after 2015. The current usage metrics is available 48-96 hours after online publication and is updated daily on week days.
Initial download of the metrics may take a while.


