Fig. 9.
Download original image
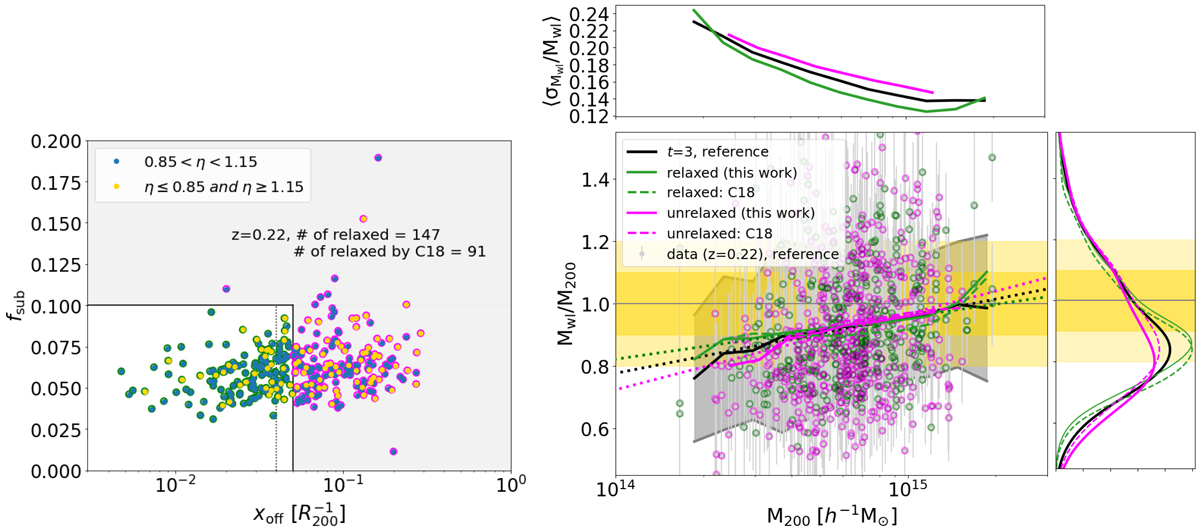
Left panel: relaxation criteria for the clusters at z = 0.22. In our analysis, we assumed the systems to be relaxed when their mass fraction in substructures fsub < 0.1 and their centre of mass offset xoff < 0.05R200, indicated by the rectangular white region in the bottom left corner. Our relaxed (unrelaxed) clusters are circled in green (purple). For comparison, we also mark the relaxation criterion by Cui et al. (2018): fsub < 0.1, xoff < 0.04R200 and the energy parameter 0.85 < η < 1.15 (filled blue circle, otherwise gold). Right panel: weak-lensing mass bias as a function of the true mass of the cluster. The circled green and magenta data points correspond to systems that are or are not relaxed, respectively. The solid green and magenta data points show the moving average of the two samples. For comparison, the dashed lines, coloured accordingly, show the results using the relaxation criteria by Cui et al. (2018). The sub-panel on the right displays the mass bias distributions for the various cluster samples, and the top panel is the average relative scatter in the weak-lensing mass estimates as a function of M200.
Current usage metrics show cumulative count of Article Views (full-text article views including HTML views, PDF and ePub downloads, according to the available data) and Abstracts Views on Vision4Press platform.
Data correspond to usage on the plateform after 2015. The current usage metrics is available 48-96 hours after online publication and is updated daily on week days.
Initial download of the metrics may take a while.