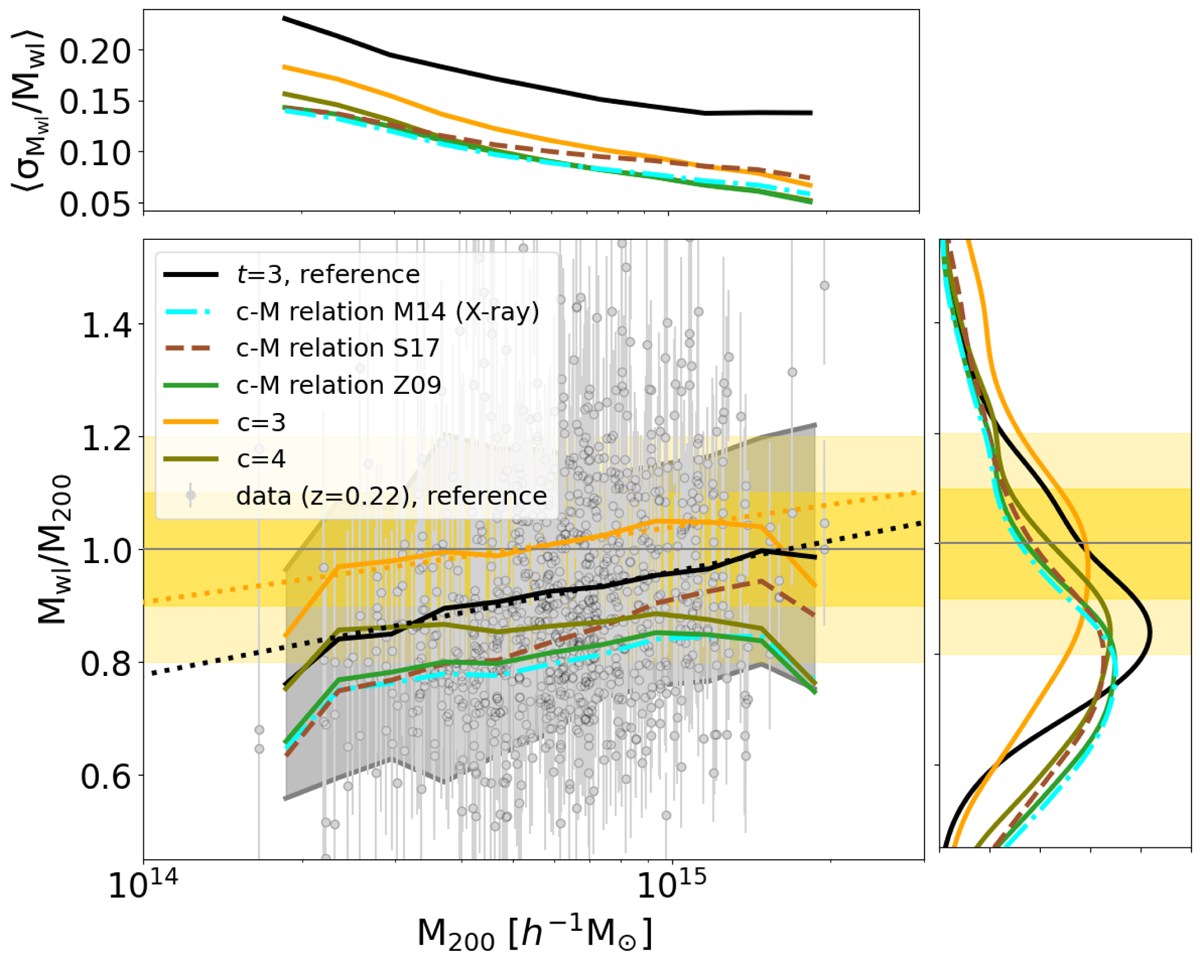
Fig. 8.
Download original image
Weak-lensing mass biases for clusters at z = 0.22. The points are the same as in Fig. 6. The different line styles and coloured curves display the moving averages for different approaches when modelling the concentration. The solid black line refers to the reference case, where we varied both the mass and the concentration in our MCMC analysis. The solid green, dotted cyan, and dark red curves refer to the case in which we assumed a concentration-mass relation model, as in the figure label. On the other side, the orange and olive curves assume a constant value of c200 = 3 and c200 = 4, respectively. The dotted coloured lines display the linear regressions to the moving average and the corresponding uncertainty (not shown for the orange data for clarity). The top and left panels show the mean relative mass uncertainties as a function of the true cluster mass and the distributions of the weak-lensing mass biases, respectively.
Current usage metrics show cumulative count of Article Views (full-text article views including HTML views, PDF and ePub downloads, according to the available data) and Abstracts Views on Vision4Press platform.
Data correspond to usage on the plateform after 2015. The current usage metrics is available 48-96 hours after online publication and is updated daily on week days.
Initial download of the metrics may take a while.