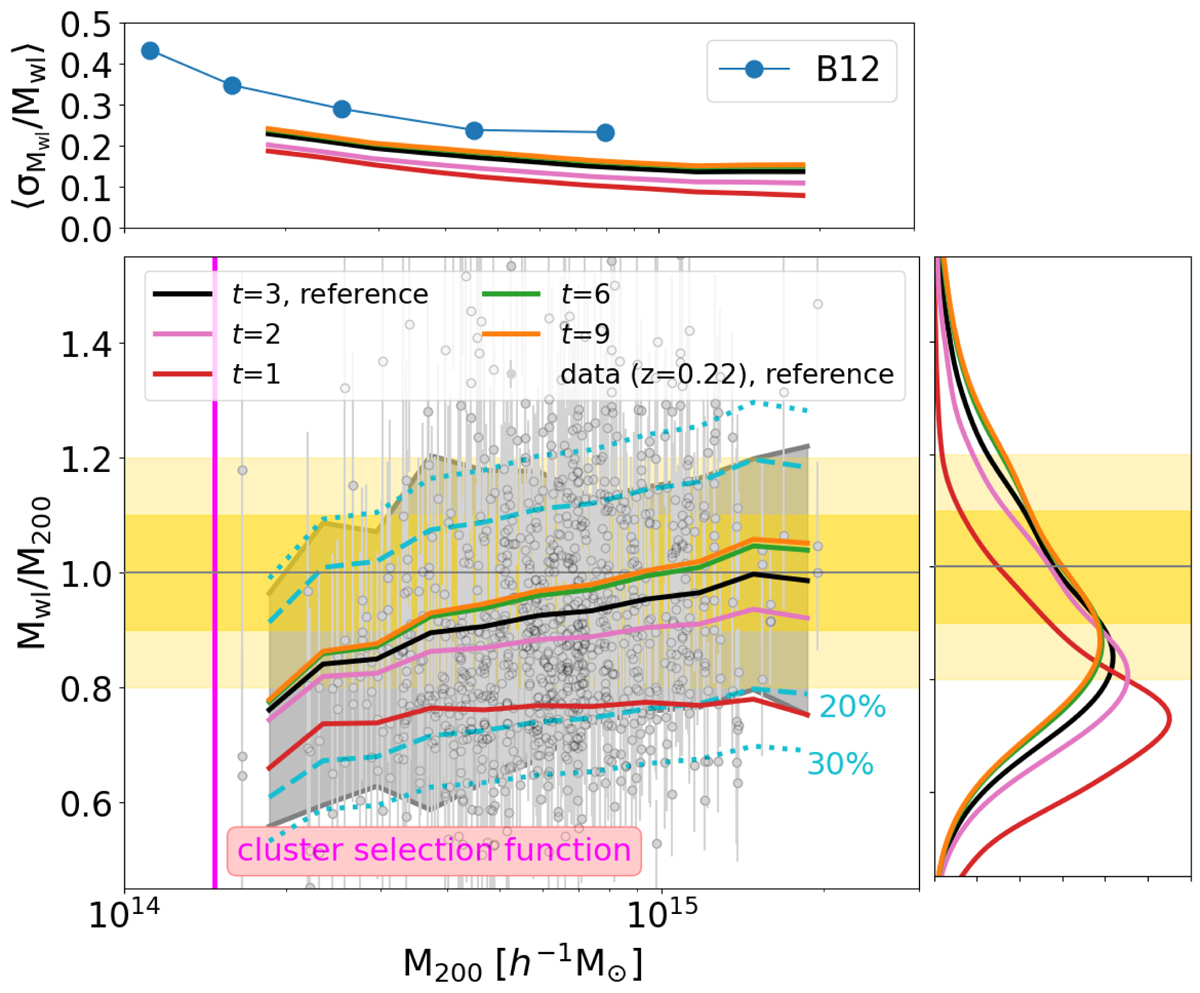
Fig. 6.
Download original image
Weak-lensing mass bias as a function of the true cluster mass for all systems at zl = 0.22 for different assumptions of the truncation factor. The data points show the ratio of the recovered weak-lensing mass obtained by fitting the excess surface mass density profile using our reference model with the one-halo term assuming a truncation radius Rt = 3R200 and the true M200 mass. The error bars correspond to the 16th and 84th percentiles of the posterior distribution. The solid black line represents the moving average of the data points. The red, pink, green, and orange lines display the moving average of the data considering the truncation radius parameter equal to t = 1, 2, 6, and 9 in our modelling function, respectively. The dashed and dotted cyan lines indicate 20 and 30% of the scatter, respectively, while the vertical magenta line indicates the minimum cluster mass, which is almost constant with redshift, and which is expected to be detected from the photometric catalogue as predicted by Sartoris et al. (2016). The light and dark yellow bands mark 10% and 20% scatter, respectively. The top subpanel displays the relative weak-lensing mass uncertainty as a function of the true cluster mass. The blue circles show the prediction by B12. The histograms in the right panel show the weak-lensing mass bias distributions over all cluster masses for the various considered cases.
Current usage metrics show cumulative count of Article Views (full-text article views including HTML views, PDF and ePub downloads, according to the available data) and Abstracts Views on Vision4Press platform.
Data correspond to usage on the plateform after 2015. The current usage metrics is available 48-96 hours after online publication and is updated daily on week days.
Initial download of the metrics may take a while.